
UNITED STATES
SECURITIES AND EXCHANGE COMMISSION
WASHINGTON, DC 20549
FORM 10-Q
☒
QUARTERLY REPORT PURSUANT TO SECTION 13 OR 15(d) OF THE SECURITIES EXCHANGE ACT OF 1934
For the quarterly period ended June 30, 2022
Or
☐
TRANSITION REPORT PURSUANT TO SECTION 13 OR 15(d) OF THE SECURITIES EXCHANGE ACT OF 1934
For the transition period from to i
Commission File No. 001-37660
Avangrid, Inc.
(Exact Name of Registrant as Specified in its Charter)
New York 14-1798693
(State or other jurisdiction of incorporation or organization) (I.R.S. Employer Identification No.)
180 Marsh Hill Road
Orange, Connecticut 06477
(Address of principal executive offices) (Zip Code)
Registrant’s telephone number, including area code: (207) 629-1190
Securities registered pursuant to Section 12(b) of the Act:
Title of each class Trading Symbol Name of exchange on which registered
Common Stock, par value $0.01 per share AGR New York Stock Exchange
Indicate by check mark whether the registrant (1) has filed all reports required to be filed by Section 13 or 15(d) of the Securities Exchange
Act of 1934 during the preceding 12 months (or for such shorter period that the registrant was required to file such reports), and (2) has been
subject to such filing requirements for the past 90 days. Yes ☒ No ☐
Indicate by check mark whether the registrant has submitted electronically every Interactive Data File required to be submitted pursuant to
Rule 405 of Regulation S-T (§ 232.405 of this chapter) during the preceding 12 months (or for such shorter period that the registrant was
required to submit such files). Yes ☒ No ☐
Indicate by check mark whether the registrant is a large accelerated filer, an accelerated filer, a non-accelerated filer, smaller reporting
company, or an emerging growth company. See the definitions of “large accelerated filer,” “accelerated filer,” “smaller reporting company,”
and “emerging growth company” in Rule 12b-2 of the Exchange Act.
Large Accelerated Filer
☒
Accelerated Filer
☐
Non-accelerated Filer
☐
Smaller Reporting Company
☐
Emerging Growth Company
☐
If an emerging growth company, indicate by check mark if the registrant has elected not to use the extended transition period for complying
with any new or revised financial accounting standards provided pursuant to Section 13(a) of the Exchange Act. ☐
Indicate by check mark whether the registrant is a shell company (as defined in Rule 12b-2 of the Exchange Act). Yes ☐ No ☒
As of July 26, 2022, the registrant had 386,624,231 shares of common stock, par value $0.01, outstanding.

Avangrid, Inc.
REPORT ON FORM 10-Q
For the Quarter Ended June 30, 2022
INDEX
GLOSSARY OF TERMS AND ABBREVIATIONS 3
PART I. FINANCIAL INFORMATION 5
Item 1. Financial Statements 5
Item 2. Management’s Discussion and Analysis of Financial Condition and Results of Operations 53
Item 3. Quantitative and Qualitative Disclosures about Market Risk 72
Item 4. Controls and Procedures 72
PART II. OTHER INFORMATION 74
Item 1. Legal Proceedings 74
Item 1A. Risk Factors 74
Item 2. Unregistered Sales of Equity Securities and Use of Proceeds 74
Item 3. Defaults Upon Senior Securities 74
Item 4. Mine Safety Disclosures 74
Item 5. Other Information 74
Item 6. Exhibits 75
SIGNATURES 76
2
GLOSSARY OF TERMS AND ABBREVIATIONS
Unless the context indicates otherwise, the terms “we,” “our” and the “Company” are used to refer to Avangrid, Inc. and its
subsidiaries.
2020 Joint Proposal
Joint proposal of NYSEG and RG&E and certain other signatory parties approved by the
NYPSC on November 19, 2020, for a three-year rate plan for electric and gas service
commencing December 1, 2020.
AOCI
Accumulated other comprehensive income
ARHI
Avangrid Renewables Holdings, Inc.
ARP
Alternative Revenue Programs
ASC
Accounting Standards Codification
AVANGRID
Avangrid, Inc.
BGC
The Berkshire Gas Company
CfDs
Contracts for Differences
CFIUS
Committee on Foreign Investment in the United States
CL&P
The Connecticut Light and Power Company
CMP
Central Maine Power Company
CNG
Connecticut Natural Gas Corporation
DEEP
Connecticut Department of Energy and Environmental Protection
DIMP
Distribution Integrity Management Program
DOC
Department of Commerce
DPA
Deferred Payment Arrangements
DPU
Massachusetts Department of Public Utilities
EBITDA
Earnings before interest, taxes, depreciation and amortization
ESM
Earnings sharing mechanism
Evergreen Power
Evergreen Power, LLC
English Station
The former generation site on the Mill River in New Haven, Connecticut
Exchange Act
The Securities Exchange Act of 1934, as amended
FASB
Financial Accounting Standards Board
FCC
Federal Communications Commission
FERC
Federal Energy Regulatory Commission
FirstEnergy
FirstEnergy Corp.
Form 10-K
Avangrid, Inc.’s Annual Report on Form 10-K for the year ended December 31, 2021, filed
with the Securities and Exchange Commission on March 1, 2022.
HLBV
Hypothetical Liquidation at Book Value
Iberdrola
Iberdrola, S.A., which owns 81.5% of the outstanding shares of Avangrid, Inc.
Iberdrola Group
The group of companies controlled by Iberdrola, S.A.
Installed capacity
The production capacity of a power plant or wind farm based either on its rated (nameplate)
capacity or actual capacity.
ISO
Independent system operator
Klamath Plant
Klamath gas-fired cogeneration facility located in the city of Klamath, Oregon.
KW
Kilowatts
LIBOR
The London Interbank Offered Rate
Merger
The merger of PNMR with and into Merger Sub on the terms and subject to the conditions set
forth in the Merger Agreement, with PNMR continuing as the surviving corporation and as a
wholly-owned subsidiary of AVANGRID.
Merger Agreement
Agreement and Plan of Merger, dated as of October 20, 2020, among AVANGRID, PNMR and
Merger Sub.
3
Merger Sub
NM Green Holdings, Inc., a New Mexico corporation and wholly-owned subsidiary of
AVANGRID.
MNG
Maine Natural Gas Corporation
MPUC
Maine Public Utility Commission
MtM
Mark-to-market
MW
Megawatts
MWh
Megawatt-hours
Networks
Avangrid Networks, Inc.
New York TransCo
New York TransCo, LLC.
NMPRC
New Mexico Public Regulation Commission
Non-GAAP
Financial measures that are not prepared in accordance with U.S. GAAP, including adjusted net
income, adjusted earnings per share, adjusted EBITDA and adjusted EBITDA with tax credits.
NRC
Nuclear Regulatory Commission
NYPSC
New York State Public Service Commission
NYSE
New York Stock Exchange
NYSEG
New York State Electric & Gas Corporation
NYSERDA
New York State Energy Research and Development Authority
OCI
Other comprehensive income
PJM
PJM Interconnection, L.L.C.
PNMR
PNM Resources, Inc.
PUCT
Public Utility Commission of Texas
PURA
Connecticut Public Utilities Regulatory Authority
Renewables
Avangrid Renewables, LLC
RDM
Revenue Decoupling Mechanism
RG&E
Rochester Gas and Electric Corporation
ROE
Return on equity
SCG
The Southern Connecticut Gas Company
SEC
United States Securities and Exchange Commission
Tax Act
Tax Cuts and Jobs Act of 2017 enacted by the U.S. federal government on December 22, 2017
TEF
Tax equity financing arrangements
UI
The United Illuminating Company
UIL
UIL Holdings Corporation
U.S. GAAP
Generally accepted accounting principles for financial reporting in the United States.
VIEs
Variable interest entities
4
PART I. FINANCIAL INFORMATION
Item 1. Financial Statements
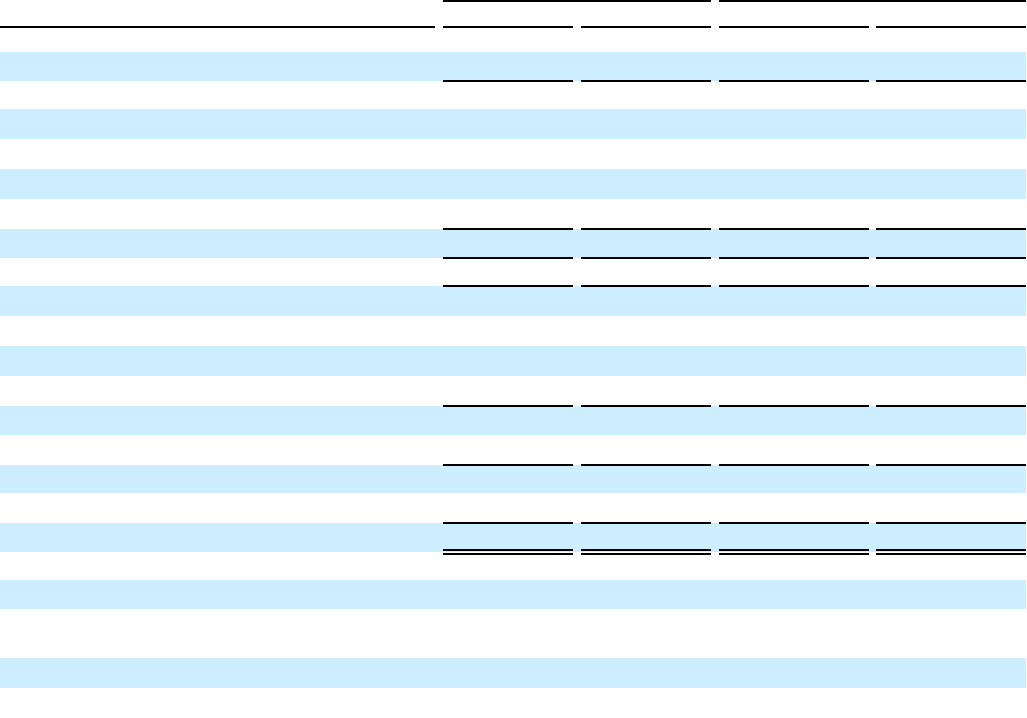
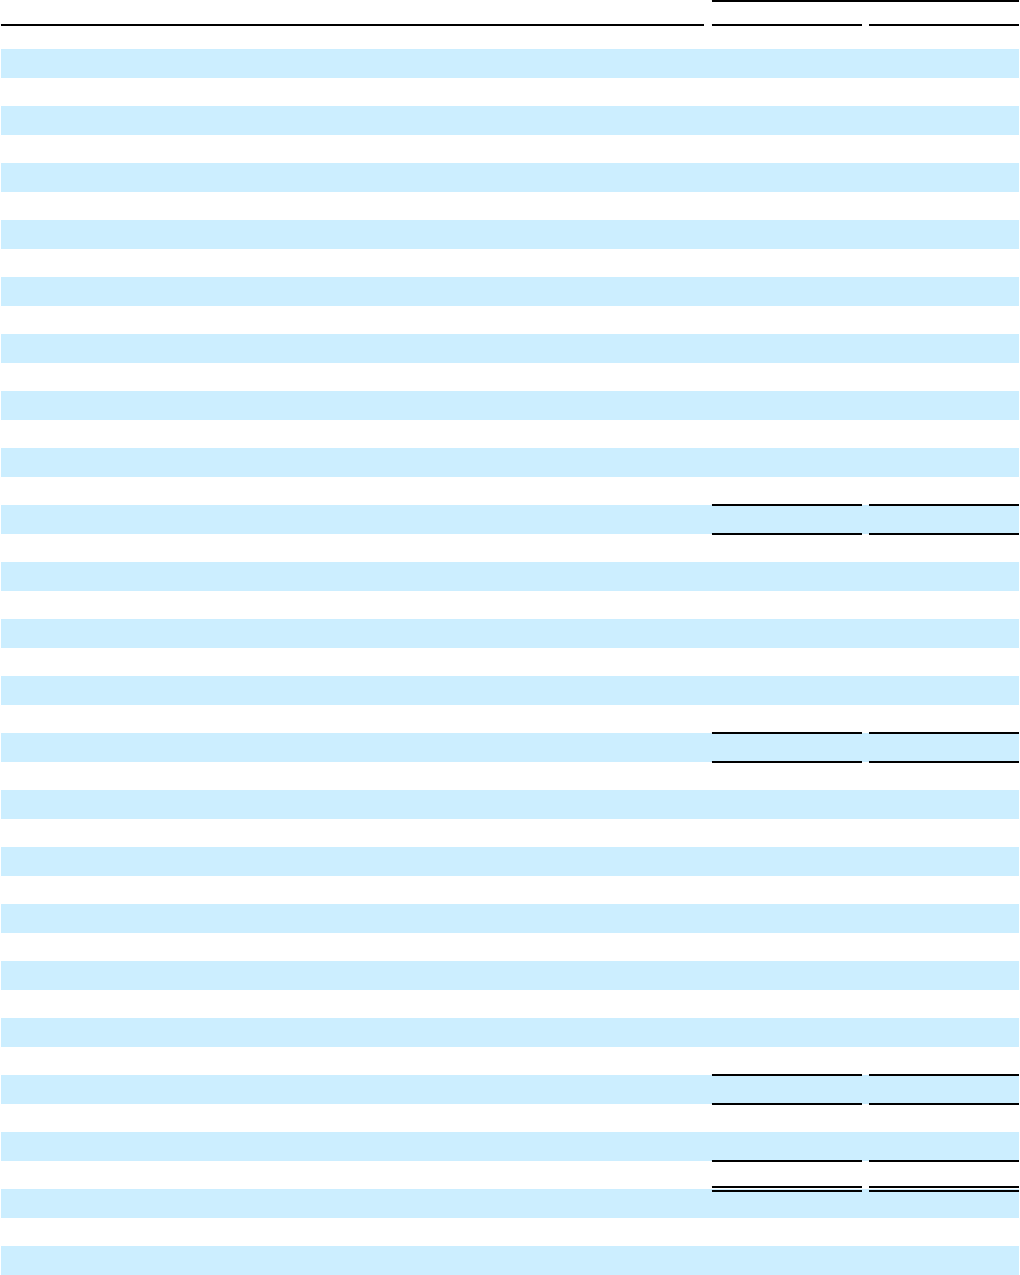
Avangrid, Inc. and Subsidiaries
Condensed Consolidated Statements of Income
(unaudited)
Three Months Ended June 30, Six Months Ended June 30,
2022 2021 2022 2021
(Millions, except for number of shares and per share data)
Operating Revenues
$ 1,794 $ 1,477 $ 3,927 $ 3,443
Operating Expenses
Purchased power, natural gas and fuel used
440 265 1,181 766
Operations and maintenance
693 676 1,344 1,318
Depreciation and amortization
271 250 532 497
Taxes other than income taxes
169 155 347 325
Total Operating Expenses
1,573 1,346 3,404 2,906
Operating Income
221 131 523 537
Other Income and (Expense)
Other income
9 34 20 35
Earnings from equity method investments
6 4 259 5
Interest expense, net of capitalization
(79) (75) (150) (148)
Income Before Income Tax
157 94 652 429
Income tax expense (benefit)
(4) 10 64 24
Net Income
161 84 588 405
Net loss attributable to noncontrolling interests 23 14 41 27
Net Income Attributable to Avangrid, Inc.
$ 184 $ 98 $ 629 $ 432
Earnings Per Common Share, Basic
$ 0.48 $ 0.28 $ 1.63 $ 1.31
Earnings Per Common Share, Diluted
$ 0.48 $ 0.28 $ 1.62 $ 1.31
Weighted-average Number of Common Shares
Outstanding:
Basic
386,736,774 347,121,197 386,717,560 328,412,163
Diluted
387,219,348 347,419,064 387,166,378 328,795,944
The accompanying notes are an integral part of our condensed consolidated financial statements.
5
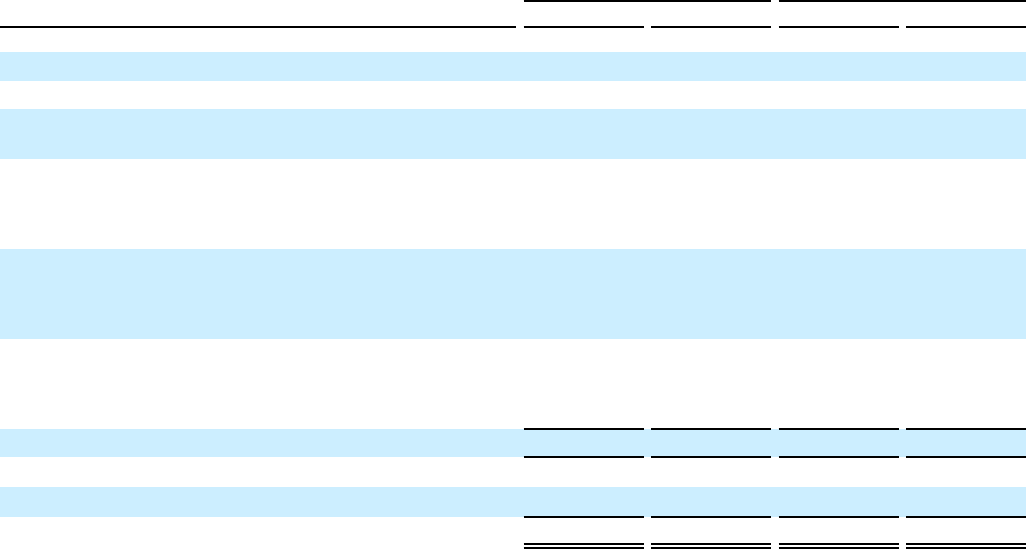
Avangrid, Inc. and Subsidiaries
Condensed Consolidated Statements of Comprehensive Income
(unaudited)
Three Months Ended June 30, Six Months Ended June 30,
2022 2021 2022 2021
(Millions)
Net Income
$ 161 $ 84 $ 588 $ 405
Other Comprehensive Income (Loss)
Loss on nonqualified pension plans, net of income tax of $3
for the six months ended — — 9 —
Unrealized (loss) gain from equity method investment, net of
income taxes of $(1) and $(4) for the three months ended,
respectively, and $4 and $(4)for the six months ended,
respectively (4) (3) 11 (3)
Unrealized (loss) gain during the period on derivatives
qualifying as cash flow hedges, net of income taxes of $15
and $(21) for the three months ended, respectively, and $0
and $(26) for the six months ended, respectively 39 (73) — (100)
Reclassification to net income of losses on cash flow hedges,
net of income taxes $2 and $(3) for the three months ended,
respectively, and $6 and $(4) for the six months ended,
respectively 6 4 17 5
Other Comprehensive Income (Loss)
41 (72) 37 (98)
Comprehensive Income 202 12 625 307
Net loss attributable to noncontrolling interests 23 14 41 27
Comprehensive Income Attributable to Avangrid, Inc.
$ 225 $ 26 $ 666 $ 334
The accompanying notes are an integral part of our condensed consolidated financial statements.
6
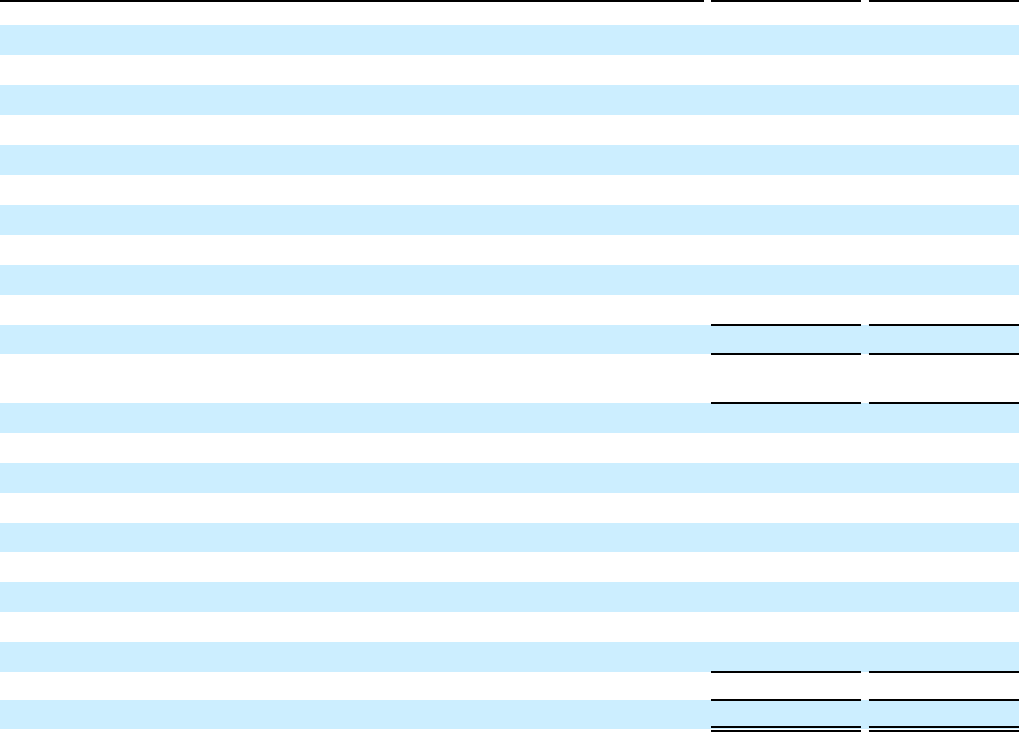
Avangrid, Inc. and Subsidiaries
Condensed Consolidated Balance Sheets
(unaudited)
June 30, December 31,
As of 2022 2021
(Millions)
Assets
Current Assets
Cash and cash equivalents
$ 411 $ 1,474
Accounts receivable and unbilled revenues, net
1,319 1,269
Accounts receivable from affiliates
2 11
Derivative assets
118 35
Fuel and gas in storage
171 139
Materials and supplies
225 204
Prepayments and other current assets
380 245
Regulatory assets
363 400
Total Current Assets
2,989 3,777
Total Property, Plant and Equipment ($2,686 and $1,959 related to VIEs,
respectively) 30,063 28,866
Operating lease right-of-use assets
151 148
Equity method investments
431 560
Other investments
49 61
Regulatory assets
2,153 2,247
Other Assets
Goodwill
3,119 3,119
Intangible assets
285 293
Derivative assets
109 59
Other
403 374
Total Other Assets
3,916 3,845
Total Assets
$ 39,752 $ 39,504
The accompanying notes are an integral part of our condensed consolidated financial statements.
7
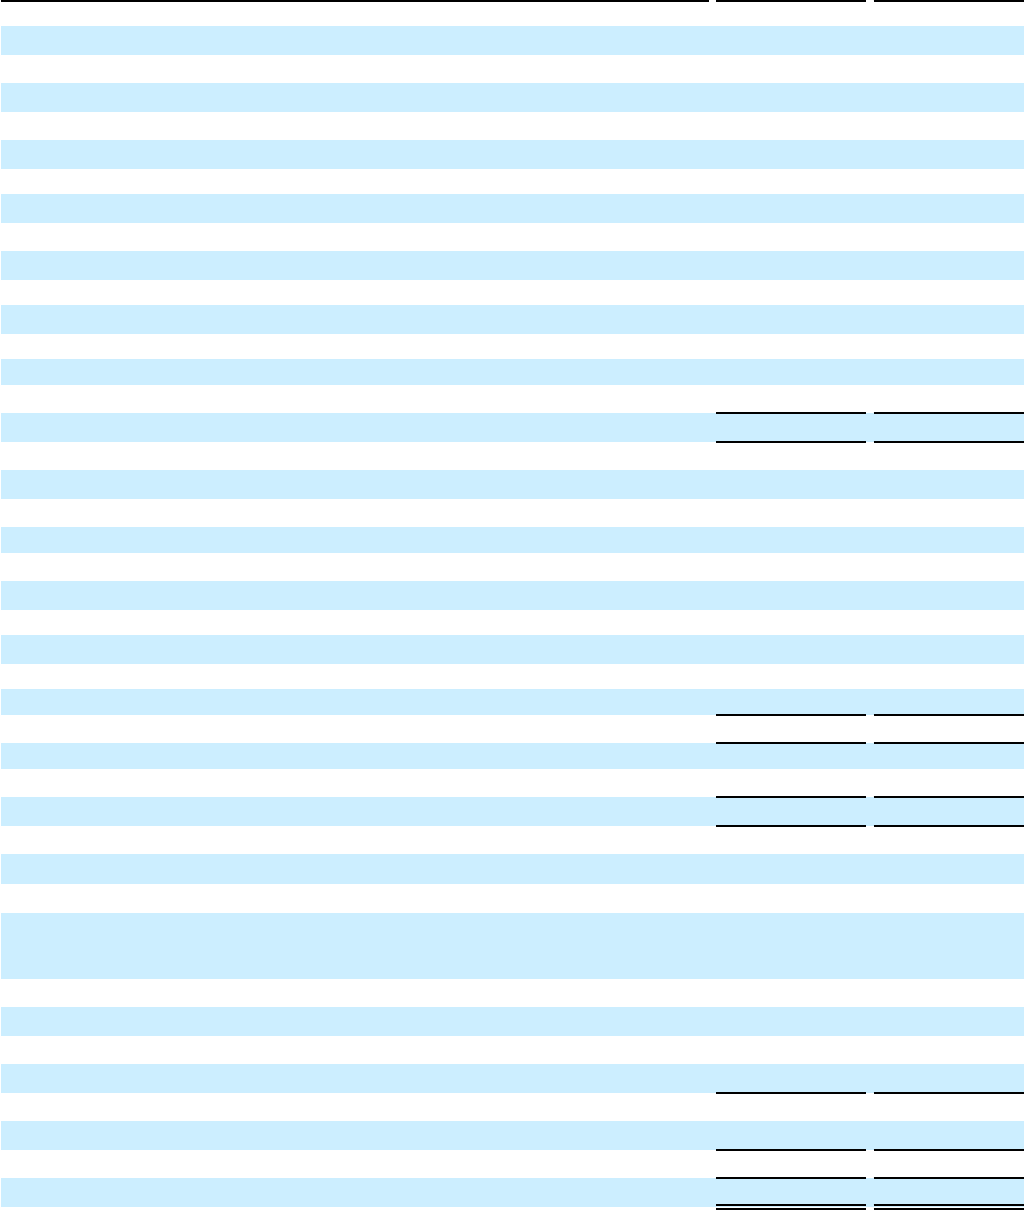
Avangrid, Inc. and Subsidiaries
Condensed Consolidated Balance Sheets
(unaudited)
June 30, December 31,
As of 2022 2021
(Millions, except share information)
Liabilities
Current Liabilities
Current portion of debt
$ 350 $ 372
Notes payable
92 159
Notes payable to affiliates
1 2
Interest accrued
67 69
Accounts payable and accrued liabilities
1,352 1,586
Accounts payable to affiliates
29 61
Dividends payable
170 170
Taxes accrued
63 43
Operating lease liabilities
11 12
Derivative liabilities
114 64
Other current liabilities
650 484
Regulatory liabilities
447 307
Total Current Liabilities
3,346 3,329
Regulatory liabilities
2,972 3,022
Other Non-current Liabilities
Deferred income taxes
2,179 2,016
Deferred income
1,096 1,130
Pension and other postretirement
457 684
Operating lease liabilities
132 149
Derivative liabilities
181 160
Asset retirement obligations
262 253
Environmental remediation costs
283 298
Other
570 580
Total Other Non-current Liabilities
5,160 5,270
Non-current debt
7,888 7,922
Total Non-current Liabilities
16,020 16,214
Total Liabilities
19,366 19,543
Commitments and Contingencies
Equity
Stockholders’ Equity:
Common stock, $.01 par value, 500,000,000 shares authorized, 387,734,757 and
387,678,630 shares issued; 386,624,231 and 386,568,104 shares outstanding,
respectively 3 3
Additional paid in capital
17,687 17,679
Treasury stock
(47) (47)
Retained earnings
2,003 1,714
Accumulated other comprehensive loss
(236) (273)
Total Stockholders’ Equity
19,410 19,076
Non-controlling interests
976 885
Total Equity
20,386 19,961
Total Liabilities and Equity
$ 39,752 $ 39,504
The accompanying notes are an integral part of our condensed consolidated financial statements.
8
Avangrid, Inc. and Subsidiaries
Condensed Consolidated Statements of Cash Flows
(unaudited)
Six Months Ended June 30,
2022 2021
(Millions)
Cash Flow from Operating Activities:
Net income $ 588 $ 405
Adjustments to reconcile net income to net cash provided by operating activities:
Depreciation and amortization 532 497
Regulatory assets/liabilities amortization and carrying cost 3 34
Pension cost (12) 23
Earnings from equity method investments (259) (5)
Distributions of earnings received from equity method investments 13 9
Unrealized loss (gain) on marked-to-market derivative contracts (5) 74
Deferred taxes 58 45
Other non-cash items (12) (19)
Changes in operating assets and liabilities:
Current assets (208) 19
Noncurrent assets (289) (129)
Current liabilities 199 (11)
Noncurrent liabilities 197 (91)
Net Cash Provided by Operating Activities 805 851
Cash Flow from Investing Activities:
Capital expenditures (1,403) (1,264)
Contributions in aid of construction 80 21
Proceeds from sale of assets 9 5
Proceeds from notes receivable from affiliates (1) 2
Distributions received from equity method investments 2 4
Other investments and equity method investments, net (179) 231
Net Cash Used in Investing Activities (1,492) (1,001)
Cash Flow from Financing Activities:
Non-current debt issuances 216 —
Repayments of non-current debt (214) (2)
Repayment of non-current debt with affiliate — (3,000)
Repayments of other short-term debt, net (162) (307)
Repayments of financing leases (7) (4)
Repurchase of common stock — (2)
Issuance of common stock (1) 3,998
Distributions to noncontrolling interests (6) (5)
Contributions from noncontrolling interests 138 10
Dividends paid (340) (272)
Net Cash (Used in) Provided by Financing Activities (376) 416
Net (Decrease) Increase in Cash, Cash Equivalents and Restricted Cash (1,063) 266
Cash, Cash Equivalents and Restricted Cash, Beginning of Period 1,477 1,467
Cash, Cash Equivalents and Restricted Cash, End of Period $ 414 $ 1,733
Supplemental Cash Flow Information
Cash paid for interest, net of amounts capitalized $ 144 $ 143
Cash paid for income taxes $ 10 $ 5
The accompanying notes are an integral part of our condensed consolidated financial statements.
9
Avangrid, Inc. and Subsidiaries
Condensed Consolidated Statements of Changes in Equity
(unaudited)
Avangrid, Inc. Stockholders
(Millions, except for number of shares )
Number of
shares (*)
Common
Stock
Additional
paid-in
capital
Treasury
Stock
Retained
Earnings
Accumulated
Other
Comprehensive
Loss
Total
Stockholders’
Equity
Noncontrolling
Interests Total
As of March 31, 2021 309,369,894 $ 3 $ 13,667 $ (16) $ 1,864 $ (137) $ 15,381 $ 611 $ 15,992
Net income (loss) — — — — 98 — 98 (14) 84
Other comprehensive income, net of tax of $(28) — — — — — (72) (72) — (72)
Comprehensive income 12
Dividends declared, $0.44/share — — — — (171) — (171) — (171)
Release of common stock held in trust 4,260 — — — — — — — —
Issuance of common stock 77,830,402 — 3,999 — — — 3,999 — 3,999
Stock-based compensation — — 5 — — — 5 — 5
Distributions to noncontrolling interests — — — — — — — (2) (2)
Contributions from noncontrolling interests — — — — (1) — (1) 1 —
As of June 30, 2021 387,204,556 $ 3 $ 17,671 $ (16) $ 1,790 $ (209) $ 19,239 $ 596 $ 19,835
As of March 31, 2022 386,624,231 $ 3 $ 17,683 $ (47) $ 1,819 $ (277) $ 19,181 $ 879 $ 20,060
Net income (loss) — — — — 184 — 184 (23) 161
Other comprehensive income, net of tax of $16 — — — — — 41 41 — 41
Comprehensive income 202
Dividends declared, $0.44/share — — — — — — — — —
Stock-based compensation — — 4 — — — 4 — 4
Distributions to noncontrolling interests — — — — — — — (5) (5)
Contributions from noncontrolling interests — — — — — — — 125 125
As of June 30, 2022 386,624,231 $ 3 $ 17,687 $ (47) $ 2,003 $ (236) $ 19,410 $ 976 $ 20,386
10
Avangrid, Inc. Stockholders
(Millions, except for number of shares )
Number of
shares (*)
Common
Stock
Additional
paid-in
capital
Treasury
Stock
Retained
Earnings
Accumulated
Other
Comprehensive
Loss
Total
Stockholders’
Equity
Noncontrolling
Interests Total
As of December 31, 2020 309,077,300 $ 3 $ 13,665 $ (14) $ 1,666 $ (111) $ 15,209 $ 617 $ 15,826
Net income (loss) — — — — 432 — 432 (27) 405
Other comprehensive loss, net of tax of $(34) — — — — — (98) (98) — (98)
Comprehensive income 307
Dividends declared, $0.88/share — — — — (307) — (307) — (307)
Release of common stock held in trust 296,854 — — — — — — — —
Issuance of common stock 77,883,713 — 3,998 — — — 3,998 — 3,998
Repurchase of common stock (53,311) — — (2) — — (2) — (2)
Stock-based compensation — — 8 — — — 8 — 8
Distributions to noncontrolling interests — — — — — — — (5) (5)
Contributions from noncontrolling interests — — — — (1) — (1) 11 10
As of June 30, 2021 387,204,556 $ 3 $ 17,671 $ (16) $ 1,790 $ (209) $ 19,239 $ 596 $ 19,835
As of December 31, 2021 386,568,104 $ 3 $ 17,679 $ (47) $ 1,714 $ (273) $ 19,076 $ 885 $ 19,961
Net income (loss) — — — — 629 — 629 (41) 588
Other comprehensive loss, net of tax of $13 — — — — — 37 37 — 37
Comprehensive income 625
Dividends declared, $0.88/share — — — — (340) — (340) — (340)
Issuance of common stock 56,127 — (1) — — — (1) — (1)
Stock-based compensation — — 9 — — — 9 — 9
Distributions to noncontrolling interests — — — — — — — (6) (6)
Contributions from noncontrolling interests — — — — — — 138 138
As of June 30, 2022 386,624,231 $ 3 $ 17,687 $ (47) $ 2,003 $ (236) $ 19,410 $ 976 $ 20,386
(*) Par value of share amounts is $0.01
The accompanying notes are an integral part of our condensed consolidated financial statements.
11
Avangrid, Inc. and Subsidiaries
Notes to Condensed Consolidated Financial Statements
(unaudited)
Note 1. Background and Nature of Operations
Avangrid, Inc. (AVANGRID, we or the Company) is an energy services holding company engaged in the regulated energy
transmission and distribution business through its principal subsidiary, Avangrid Networks, Inc. (Networks), and in the
renewable energy generation business through its principal subsidiary, Avangrid Renewables Holding, Inc. (ARHI). ARHI in
turn holds subsidiaries including Avangrid Renewables, LLC (Renewables). Iberdrola, S.A. (Iberdrola), a corporation organized
under the laws of the Kingdom of Spain, owns 81.6% of the outstanding common stock of AVANGRID. The remaining
outstanding shares are owned by various shareholders with approximately 18.4% of AVANGRID's outstanding shares publicly
traded on the New York Stock Exchange (NYSE).
Proposed Merger with PNMR
On October 20, 2020, AVANGRID, PNM Resources, Inc., a New Mexico corporation (PNMR) and NM Green Holdings, Inc.,
a New Mexico corporation and wholly-owned subsidiary of AVANGRID (Merger Sub), entered into an Agreement and Plan of
Merger (Merger Agreement), pursuant to which Merger Sub is expected to merge with and into PNMR, with PNMR surviving
the Merger as a direct wholly-owned subsidiary of AVANGRID (Merger). Pursuant to the Merger Agreement, each issued and
outstanding share of the common stock of PNMR (PNMR common stock) (other than (i) the issued shares of PNMR common
stock that are owned by AVANGRID, Merger Sub, PNMR or any wholly-owned subsidiary of AVANGRID or PNMR, which
will be automatically cancelled at the time the Merger is consummated and (ii) shares of PNMR common stock held by a holder
who has not voted in favor of, or consented in writing to, the Merger who is entitled to, and who has demanded, payment for
fair value of such shares) will be converted, at the time the Merger is consummated, into the right to receive $50.30 in cash
(Merger Consideration).
Consummation of the Merger (Closing) is subject to the satisfaction or waiver of certain customary closing conditions,
including, without limitation, the approval of the Merger Agreement by the holders of at least a majority of the outstanding
shares of PNMR common stock entitled to vote thereon, the absence of any material adverse effect on PNMR, the receipt of
certain required regulatory approvals (including approvals from the Public Utility Commission of Texas (PUCT), the New
Mexico Public Regulation Commission (NMPRC), the Federal Energy Regulatory Commission (FERC), the Federal
Communications Commission (FCC), the Committee on Foreign Investment in the United States (CFIUS), the Nuclear
Regulatory Commission (NRC) and approval under the Hart-Scott-Rodino Antitrust Improvements Act of 1976), the Four
Corners Divestiture Agreements (as defined below) being in full force and effect and all applicable regulatory filings associated
therewith being made, as well as holders of no more than 15% of the outstanding shares of PNMR common stock validly
exercising their dissenters’ rights. On February 12, 2021, the shareholders of PNMR approved the proposed Merger. As of
November 1, the Merger had obtained all regulatory approvals other than from the NMPRC. On November 1, 2021, after public
hearing and briefing on the matter, the hearing examiner in the Merger proceeding at the NMPRC issued an unfavorable
recommendation related to the amended stipulated agreement entered into by PNMR, AVANGRID and several interveners in
the NMPRC proceeding with respect to consideration of the joint Merger application in June 2021. On December 8, 2021, the
NMPRC issued an order rejecting the amended stipulated agreement. On January 3, 2022, AVANGRID and PNMR filed a
notice of appeal of the December 8, 2021 decision of the NMPRC with the New Mexico Supreme Court. The Statement of
Issues was filed on February 2, 2022 and the Brief in Chief was filed on April 7, 2022. On June 14, 2022, the NMPRC filed its
Answer Brief. On June 13, 2022, New Energy Economy, an intervener in the Merger proceeding, filed its Answer Brief.
AVANGRID's Reply Brief is due on August 5, 2022 (pending any additional extensions granted to the parties). On February
24, 2022, the FCC granted an extension to its approval to transfer operating licenses in connection with the Merger.
In addition, on January 3, 2022, AVANGRID, PNMR and Merger Sub entered into an Amendment to the Merger Agreement
(the Amendment), pursuant to which AVANGRID, PNMR and Merger Sub each agreed to extend the “End Date” for
consummation of the Merger until April 20, 2023. The parties acknowledge in the Amendment that the required regulatory
approval from the NMPRC has not been obtained and that the parties have reasonably determined that such outstanding
approval will not be obtained by April 20, 2022. In light of this outstanding approval, the parties determined to approve the
Amendment. As amended, the Merger Agreement may be terminated by each of AVANGRID and PNMR under certain
circumstances, including if the Merger is not consummated by April 20, 2023 (subject to a three-month extension by
AVANGRID and PNMR by mutual consent if all of the conditions to the closing, other than the conditions related to obtaining
regulatory approvals, have been satisfied or waived). During the pendency of this appeal certain required regulatory approvals
and consents may expire and AVANGRID and PNMR will reapply and/or apply for extensions of such approvals, as the case
may be. We cannot predict the outcome of this proceeding for the outstanding approvals.
12
The Merger Agreement contains representations, warranties and covenants of PNMR, AVANGRID and Merger Sub, which are
customary for transactions of this type. In addition, among other things, the Merger Agreement contains a covenant requiring
PNMR to, prior to the closing, enter into agreements (Four Corners Divestiture Agreements) providing for, and to make filings
required to, exit from all ownership interests in the Four Corners Power Plant, all with the objective of having the closing date
for such exit be no later than December 31, 2024.
The Merger Agreement (as amended) provides for certain customary termination rights including the right of either party to
terminate the Merger Agreement if the Merger is not completed on or before April 20, 2023 (subject to a three-month extension
by AVANGRID and PNMR by mutual consent if all of the conditions to the closing, other than the conditions related to
obtaining regulatory approvals, have been satisfied or waived). The Merger Agreement further provides that, upon termination
of the Merger Agreement under certain specified circumstances (including if AVANGRID terminates the Merger Agreement
due to a change in recommendation of the board of directors of PNMR or if PNMR terminates the Merger Agreement to accept
a superior proposal (as defined in the Merger Agreement)), PNMR will be required to pay AVANGRID a termination fee of
$130 million. In addition, the Merger Agreement provides that (i) if the Merger Agreement is terminated by either party due to
a failure of a regulatory closing condition and such failure is the result of AVANGRID’s breach of its regulatory covenants, or
(ii) AVANGRID fails to effect the Closing when all closing conditions have been satisfied and it is otherwise obligated to do so
under the Merger Agreement, then, in either such case, upon termination of the Merger Agreement, AVANGRID will be
required to pay PNMR a termination fee of $184 million as the sole and exclusive remedy. Upon the termination of the Merger
Agreement under certain specified circumstances involving a breach of the Merger Agreement, either PNMR or AVANGRID
will be required to reimburse the other party’s reasonable and documented out-of-pocket fees and expenses up to $10 million
(which amount will be credited toward, and offset against, the payment of any applicable termination fee).
In connection with the Merger, Iberdrola has provided AVANGRID a commitment letter (Iberdrola Funding Commitment
Letter), pursuant to which Iberdrola has unilaterally agreed to provide to AVANGRID, or arrange the provision to AVANGRID
of, funds to the extent necessary for AVANGRID to consummate the Merger, including the payment of the aggregate Merger
Consideration.
On April 15, 2021, AVANGRID entered into a side letter agreement with Iberdrola, which sets forth certain terms and
conditions relating to the Iberdrola Funding Commitment Letter (the Side Letter Agreement). The Side Letter Agreement
provides that any drawing in the form of indebtedness made by the Corporation pursuant to the Funding Commitment Letter
shall bear interest at an interest rate equal to 3-month LIBOR plus 0.75% per annum calculated on the basis of a 360-day year
for the actual number of days elapsed and, commencing on the date of the Funding Commitment Letter, we shall pay Iberdrola
a facility fee equal to 0.12% per annum on the undrawn portion of the funding commitment set forth in the Funding
Commitment Letter.
On May 18, 2021, we issued 77,821,012 shares of common stock in two private placements. Iberdrola purchased 63,424,125
shares and Hyde Member LLC, a Delaware limited liability company and a wholly owned subsidiary of Qatar Investment
Authority, purchased 14,396,887 shares of our common stock, par value $0.01 per share, at the purchase price of $51.40 per
share, which was the closing price of the shares of our common stock on the NYSE as of May 11, 2021. Proceeds of the private
placements were $4,000 million. $3,000 million of the proceeds were used to repay the Iberdrola Loan. After the effect of the
private placements, Iberdrola retained its 81.6% ownership interest in AVANGRID.
Note 2. Basis of Presentation
The accompanying condensed consolidated financial statements should be read in conjunction with the Form 10-K for the fiscal
year ended December 31, 2021.
The accompanying unaudited financial statements are prepared on a consolidated basis and include the accounts of
AVANGRID and its consolidated subsidiaries, Networks and ARHI. All intercompany transactions and accounts have been
eliminated in consolidation. The year-end balance sheet data was derived from audited financial statements. The unaudited
condensed consolidated financial statements for the interim periods have been prepared in accordance with accounting
principles generally accepted in the United States of America (U.S. GAAP) for interim financial information and with the
instructions to Form 10-Q and Article 10 of Regulation S-X. Accordingly, the interim condensed consolidated financial
statements do not include all the information and note disclosures required by U.S. GAAP for complete financial statements.
In the opinion of management, the accompanying condensed consolidated financial statements contain all adjustments
necessary to present fairly our condensed consolidated financial statements for the interim periods described herein. All such
adjustments are of a normal and recurring nature, except as otherwise disclosed. The results for the three and six months ended
June 30, 2022, are not necessarily indicative of the results for the entire fiscal year ending December 31, 2022.
13
Note 3. Significant Accounting Policies and New Accounting Pronouncements
The new accounting pronouncements we have adopted as of January 1, 2022, and reflected in our condensed consolidated
financial statements are described below. There have been no other material changes to the significant accounting policies
described in our Form 10-K for the fiscal year ended December 31, 2021, except for those described below resulting from the
adoption of new authoritative accounting guidance issued by the Financial Accounting Standards Board (FASB).
Adoption of New Accounting Pronouncements
(a) Facilitation of the effects of reference rate reform on financial reporting, and subsequent scope clarification
In March 2020, the FASB issued amendments and created ASC 848 to provide temporary optional guidance to entities to ease
the potential burden in accounting for, or recognizing the effects of, reference rate reform on financial reporting. The
amendments respond to concerns about structural risks of interbank offered rates, and particularly, the risk of cessation of the
London Interbank Offered Rate (LIBOR). The guidance is elective and applies to all entities, subject to meeting certain criteria,
that have contracts, hedging relationships, and other transactions that reference LIBOR or another reference rate expected to be
discontinued due to reference rate reform, around the end of 2021. The guidance applies to contracts that have modified terms
that affect, or have the potential to affect, the amount or timing of contractual cash flows resulting from the discontinuance of
the reference rate reform. The amendments are effective for all entities as of March 12, 2020, through December 31, 2022,
although the FASB has indicated it will monitor developments in the marketplace and consider whether developments warrant
an extension.
In January 2021, the FASB issued amendments to clarify the scope of ASC 848 and respond to questions from stakeholders
about whether ASC 848 can be applied to derivative instruments that do not reference a rate that is expected to be discontinued
but that use an interest rate for margining, discounting, or contract price alignment that is modified because of reference rate
reform. The modification, commonly referred to as the “discounting transition,” may have accounting implications, raising
concerns about the need to reassess previous accounting determinations related to those derivatives and about the possible
hedge accounting consequences of the discounting transition. The amendments clarify that certain optional expedients and
exceptions in ASC 848 for contract modifications and hedge accounting apply to derivatives that are affected by the discounting
transition, capture the incremental consequences of the scope clarification and tailor the existing guidance to derivative
instruments affected by the discounting transition. The amendments are effective immediately, and may be elected
retrospectively to eligible modifications as of any date from the beginning of the interim period that includes March 12, 2020,
or prospectively to new modifications made on or after any date within the interim period that includes January 7, 2021.
We expect our adoption of reference rate reform and the subsequent scope clarification will not materially affect our
consolidated results of operations, financial position and cash flows.
(b) Disclosures by business entities about government assistance
In November 2021, the FASB issued amendments that apply to business entities (all entities except specified not-for-profit
entities and employee benefit plans) that account for a transaction with a government by applying a grant or contribution
accounting model by analogy to other accounting guidance (such as a grant model within International Accounting Standards
20 Accounting for Government Grants and Disclosure of Government Assistance, or ASC Subtopic 958-605, Not-For-Profit
Entities—Revenue Recognition). Government assistance can include tax credits (excluding transactions within the scope of
Topic 740, Income Taxes), cash grants, grants of other assets, and project grants. Often, government assistance is provided to
an entity for a particular purpose, and the entity promises to take specific actions. Transactions with a government, as used in
ASC 832, Government Assistance, include assistance administered by domestic, foreign, local (city, town, county, municipal),
regional (state, provincial, territorial), and national (federal) governments and entities related to those governments. The
amendments require annual disclosures in notes to financial statements about transactions with a government as follows: (1)
information about the nature of the transactions and the related accounting policy used to account for the transactions, (2) the
line items on the balance sheet and income statement affected by the transactions, and the amounts applicable to each financial
statement line item, and (3) significant terms and conditions of the transactions, including commitments and contingencies. For
entities within scope the amendments are effective for annual periods beginning after December 15, 2021, with early
application permitted. The amendments are to be applied either (1) prospectively to transactions within the scope of the
amendments that are reflected in financial statements at the date of initial application and new transactions that are entered into
after the date of initial application or (2) retrospectively to those transactions. Our adoption of the amendments on January 1,
2022 did not materially affect our disclosures.
Accounting Pronouncements Issued but Not Yet Adopted
The following are new accounting pronouncements not yet adopted, including those issued since December 31, 2021, that we
have evaluated or are evaluating to determine their effect on our condensed consolidated financial statements.
14
(a) Troubled Debt Restructurings and Vintage Disclosures
In March 2022, the FASB issued amendments to ASC 326 to provide guidance for troubled debt restructurings (TDRs) and
vintage disclosures. For TDRs, the update requires entities to measure and record lifetime expected credit losses on an asset that
is within scope of Topic 326. The prior guidance in Topic 310 of designating a loan as a TDR was considered unnecessarily
complex. For vintage disclosures, the amendments require an entity to disclose current-period gross write-offs by year of
origination for financing receivables and net investments in leases within the scope of Subtopic 326-20.
The amendments are effective for fiscal years beginning after December 15, 2022, including interim periods within those fiscal
years. The amendments should be applied prospectively, except as provided in the next sentence. For the transition method
related to the recognition of TDRs, an entity has the option to apply a modified retrospective transition method, resulting in a
cumulative-effect adjustment to retained earnings in the period of adoption. Early adoption is permitted.
We expect our adoption will not materially affect our consolidated results of operations, financial position and cash flows.
Note 4. Revenue
We recognize revenue when we have satisfied our obligations under the terms of a contract with a customer, which generally
occurs when the control of promised goods or services transfers to the customer. We measure revenue as the amount of
consideration we expect to receive in exchange for providing those goods or services. Contracts with customers may include
multiple performance obligations. For such contracts, we allocate revenue to each performance obligation based on its relative
standalone selling price. We generally determine standalone selling prices based on the prices charged to customers. Certain
revenues are not within the scope of ASC 606, such as revenues from leasing, derivatives, other revenues that are not from
contracts with customers and other contractual rights or obligations, and we account for such revenues in accordance with the
applicable accounting standards. We exclude from revenue amounts collected on behalf of third parties, including any such
taxes collected from customers and remitted to governmental authorities. We do not have any significant payment terms that are
material because we receive payment at or shortly after the point of sale.
The following describes the principal activities, by reportable segment, from which we generate revenue. For more detailed
information about our reportable segments, refer to Note 13.
Networks Segment
Networks derives its revenue primarily from tariff-based sales of electricity and natural gas service to customers in New York,
Connecticut, Maine and Massachusetts, with no defined contractual term. For such revenues, we recognize revenues in an
amount derived from the commodities delivered to customers. Other major sources of revenue are electricity transmission and
wholesale sales of electricity and natural gas.
Tariff-based sales are subject to the corresponding state regulatory authorities, which determine prices and other terms of
service through the ratemaking process. The applicable tariffs are based on the cost of providing service. The utilities’ approved
base rates are designed to recover their allowable operating costs, including energy costs, finance costs, and the costs of equity,
the last of which reflect our capital ratio and a reasonable return on equity. We traditionally invoice our customers by applying
approved base rates to usage. Maine state law prohibits the utility from providing the electricity commodity to customers. In
New York, Connecticut and Massachusetts, customers have the option to obtain the electricity or natural gas commodity
directly from the utility or from another supplier. For customers that receive their commodity from another supplier, the utility
acts as an agent and delivers the electricity or natural gas provided by that supplier. Revenue in those cases is only for providing
the service of delivery of the commodity.
Transmission revenue results from others’ use of the utility’s transmission system to transmit electricity and is subject to FERC
regulation, which establishes the prices and other terms of service. Long-term wholesale sales of electricity are based on
individual bilateral contracts. Short-term wholesale sales of electricity are generally on a daily basis based on market prices and
are administered by the Independent System Operator-New England (ISO-NE) and the New York Independent System
Operator (NYISO) or PJM Interconnection, L.L.C. (PJM), as applicable. Wholesale sales of natural gas are generally short-term
based on market prices through contracts with the specific customer.
The performance obligation in all arrangements is satisfied over time because the customer simultaneously receives and
consumes the benefits as Networks delivers or sells the electricity or natural gas or provides the delivery or transmission
service.
Certain Networks entities record revenue from Alternative Revenue Programs (ARPs), which is not ASC 606 revenue. Such
programs represent contracts between the utilities and their regulators. The Networks ARPs include revenue decoupling
15
mechanisms (RDMs), other ratemaking mechanisms, annual revenue requirement reconciliations and other demand side
management programs.
Networks also has various other sources of revenue including billing, collection, other administrative charges, sundry billings,
rent of utility property and miscellaneous revenue. It classifies such revenues as other ASC 606 revenues to the extent they are
not related to revenue generating activities from leasing, derivatives or ARPs.
Renewables Segment
Renewables derives its revenue primarily from the sale of energy, transmission, capacity and other related charges from its
renewable wind, solar and thermal energy generating sources. For such revenues, we will recognize revenues in an amount
derived from the commodities delivered and from services as they are made available. Renewables has bundled power purchase
agreements consisting of electric energy, transmission, capacity and/or renewable energy credits (RECs). The related contracts
are generally long-term with no stated contract amount, that is, the customer is entitled to all or a percentage of the unit’s
output. Renewables also has unbundled sales of electric energy and capacity, RECs and natural gas, which are generally for
periods of less than a year. The performance obligations in substantially all of both bundled and unbundled arrangements for
electricity and natural gas are satisfied over time, for which we record revenue based on the amount invoiced to the customer
for the actual energy delivered. The performance obligation for stand-alone RECs is satisfied at a point in time, for which we
record revenue when the performance obligation is satisfied upon delivery of the REC.
Renewables classifies certain contracts for the sale of electricity as derivatives, in accordance with the applicable accounting
standards. Renewables also has revenue from its energy trading operations, which it generally classifies as derivative revenue.
However, trading contracts not classified as derivatives are within the scope of ASC 606, with the performance obligation of
the delivery of energy (electricity, natural gas) and settlement of the contracts satisfied at a point in time at which time we
recognize the revenue. Renewables also has other ASC 606 revenue, which we recognize based on the amount invoiced to the
customer.
Other
Other, which does not represent a segment, includes miscellaneous Corporate revenues and intersegment eliminations.
Contract Costs and Contract Liabilities
We recognize an asset for incremental costs of obtaining a contract with a customer when we expect the benefit of those costs
to be longer than one year. We have contract assets for costs from development success fees, which we paid during the solar
asset development period in 2018, and will amortize ratably into expense over the 15-year life of the power purchase agreement
(PPA), expected to commence in December 2022 upon commercial operation. Contract assets totaled $9 million at both
June 30, 2022 and December 31, 2021, and are presented in "Other non-current assets" on our condensed consolidated balance
sheets.
We have contract liabilities for revenue from transmission congestion contract (TCC) auctions, for which we receive payment
at the beginning of an auction period, and amortize ratably each month into revenue over the applicable auction period. The
auction periods range from six months to two years. TCC contract liabilities totaled $14 million and $16 million at June 30,
2022 and December 31, 2021, respectively, and are presented in "Other current liabilities" on our condensed consolidated
balance sheets. We recognized $6 million and $14 million as revenue during the three and six months ended June 30, 2022,
respectively, and $5 million and $9 million for the three and six months ended June 30, 2021, respectively.
16
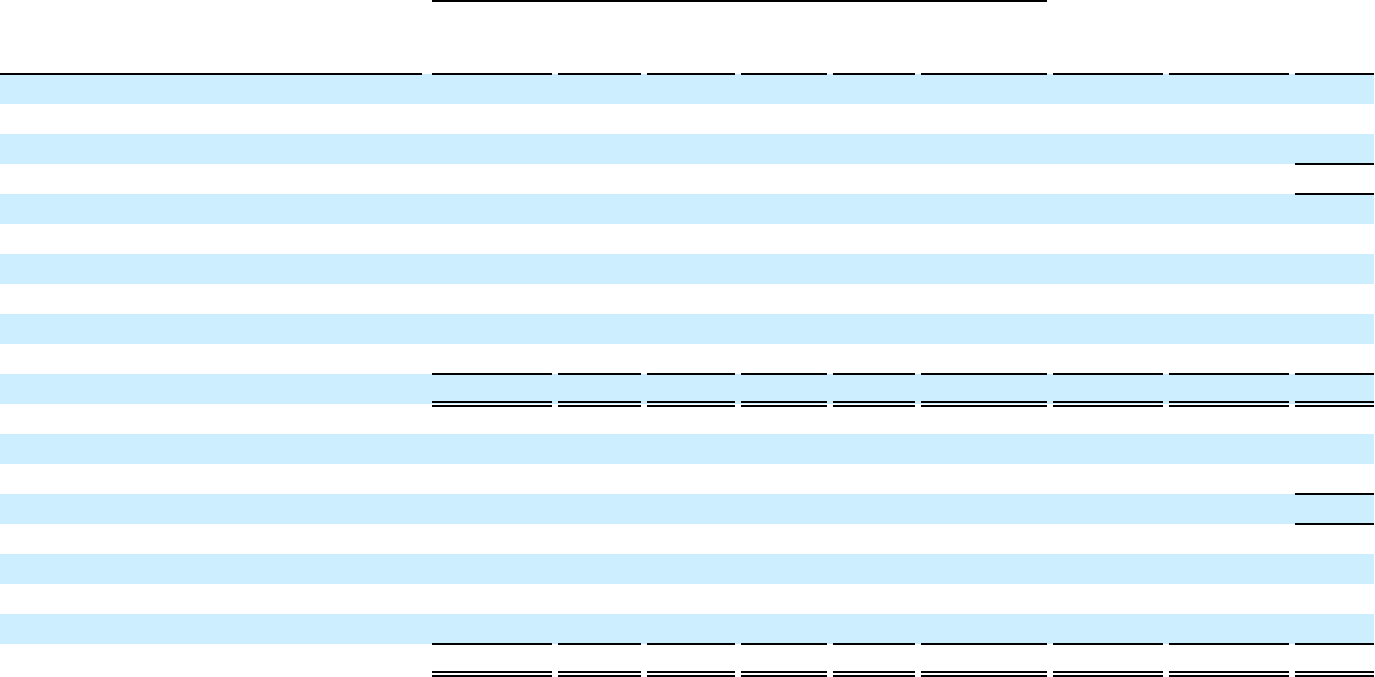
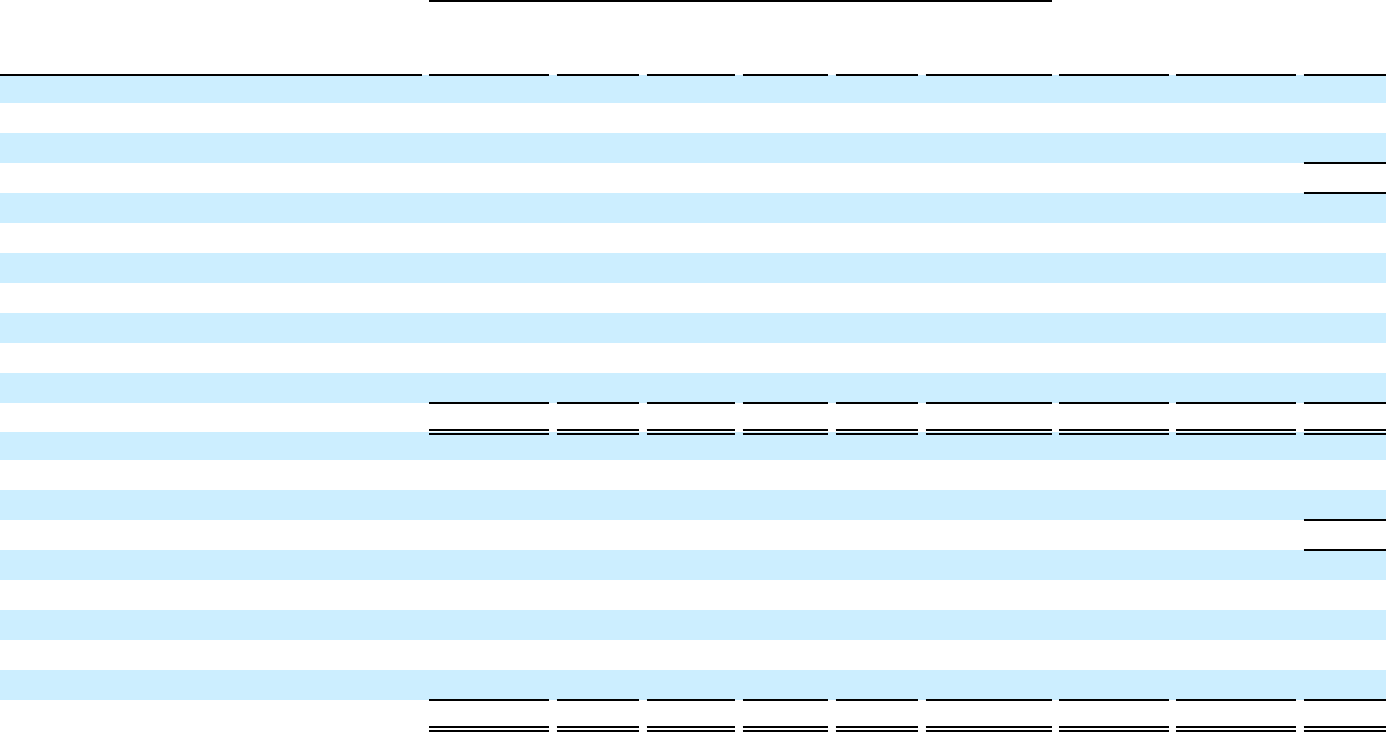
Revenues disaggregated by major source for our reportable segments for the three and six months ended June 30, 2022 and
2021 are as follows:
Three Months Ended June 30, 2022 Six Months Ended June 30, 2022
Networks Renewables Other (b) Total Networks Renewables Other (b) Total
(Millions)
Regulated operations –
electricity
$ 1,029 $ — $ — $ 1,029 $ 2,199 $ — $ — $ 2,199
Regulated operations –
natural gas
350 — — 350 1,071 — — 1,071
Nonregulated operations –
wind
— 277 — 277 — 497 — 497
Nonregulated operations –
solar
— 9 — 9 — 16 — 16
Nonregulated operations –
thermal
— 11 — 11 — 24 — 24
Other(a)
37 26 — 63 59 42 — 101
Revenue from contracts
with customers
1,416 323 — 1,739 3,329 579 — 3,908
Leasing revenue
1 — — 1 4 — — 4
Derivative revenue
— 5 — 5 — (58) — (58)
Alternative revenue programs
24 — — 24 36 — — 36
Other revenue
23 2 — 25 30 7 — 37
Total operating revenues
$ 1,464 $ 330 $ — $ 1,794 $ 3,399 $ 528 $ — $ 3,927
Three Months Ended June 30, 2021 Six Months Ended June 30, 2021
Networks Renewables Other (b) Total Networks Renewables Other (b) Total
(Millions)
Regulated operations –
electricity
$ 912 $ — $ — $ 912 $ 1,854 $ — $ — $ 1,854
Regulated operations –
natural gas
256 — — 256 820 — — 820
Nonregulated operations –
wind
— 243 — 243 — 614 — 614
Nonregulated operations –
solar
— 7 — 7 — 11 — 11
Nonregulated operations –
thermal
— 16 — 16 — 28 — 28
Other(a)
14 41 — 55 24 73 — 97
Revenue from contracts
with customers
1,182 307 — 1,489 2,698 726 — 3,424
Leasing revenue
3 — — 3 5 — — 5
Derivative revenue
— (63) — (63) — (94) — (94)
Alternative revenue
programs
22 — — 22 69 — — 69
Other revenue
12 14 — 26 20 19 — 39
Total operating revenues
$ 1,219 $ 258 $ — $ 1,477 $ 2,792 $ 651 $ — $ 3,443
(a) Primarily includes certain intra-month trading activities, billing, collection and administrative charges, sundry billings and
other miscellaneous revenue.
(b) Does not represent a segment. Includes Corporate and intersegment eliminations.
As of June 30, 2022 and December 31, 2021, accounts receivable balances related to contracts with customers were
approximately $1,228 million and $1,220 million, respectively, including unbilled revenues of $315 million and $405 million,
which are included in “Accounts receivable and unbilled revenues, net” on our condensed consolidated balance sheets.
17

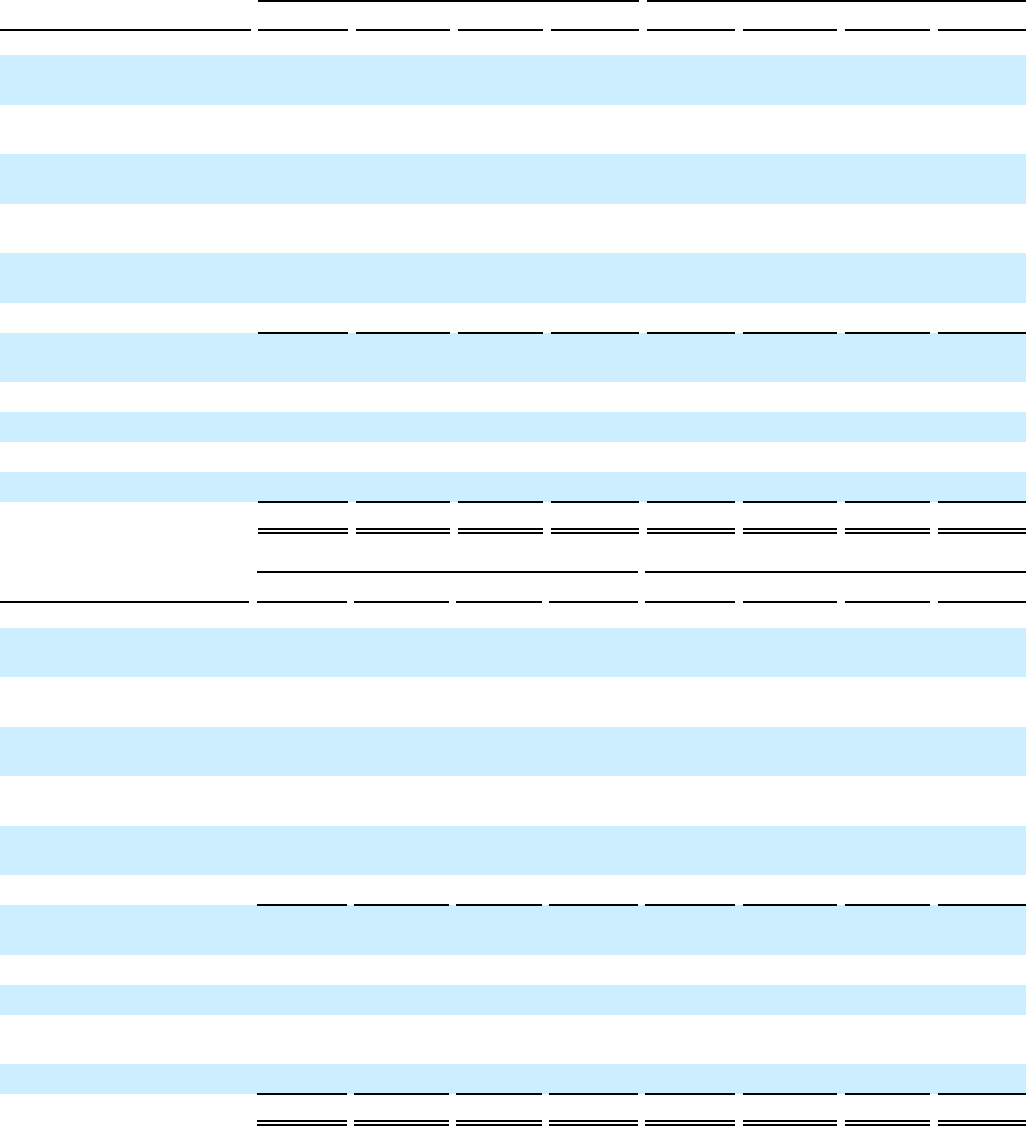
As of June 30, 2022, the aggregate amount of the transaction price allocated to performance obligations that are unsatisfied (or
partially unsatisfied) were as follows:
As of June 30, 2022 2023 2024 2025 2026 2027 Thereafter Total
(Millions)
Revenue expected to be recognized on
multiyear retail energy sales contracts in
place $ 1 $ 1 $ — $ — $ — $ — $ 2
Revenue expected to be recognized on
multiyear capacity and carbon-free
energy sale contracts 60 14 12 10 7 60 163
Revenue expected to be recognized on
multiyear renewable energy credit sale
contracts 32 28 11 2 1 1 75
Total operating revenues
$ 93 $ 43 $ 23 $ 12 $ 8 $ 61 $ 240
As of June 30, 2022, the aggregate amount of the transaction price allocated to performance obligations that are unsatisfied (or
partially unsatisfied) for the remainder of 2022 was $39 million.
Note 5. Regulatory Assets and Liabilities
Pursuant to the requirements concerning accounting for regulated operations, our utilities capitalize, as regulatory assets,
incurred and accrued costs that are probable of recovery in future electric and natural gas rates. We base our assessment of
whether recovery is probable on the existence of regulatory orders that allow for recovery of certain costs over a specific period,
or allow for reconciliation or deferral of certain costs. When costs are not treated in a specific regulatory order, we use
regulatory precedent to determine if recovery is probable. Our operating utilities also record, as regulatory liabilities,
obligations to refund previously collected revenue or to spend revenue collected from customers on future costs. The primary
items that are not included in rate base or accruing carrying costs are regulatory assets for qualified pension and other
postretirement benefits, which reflect unrecognized actuarial gains and losses; debt premium; environmental remediation costs,
which are primarily the offset of accrued liabilities for future spending; unfunded future income taxes, which are the offset to
the unfunded future deferred income tax liability recorded; asset retirement obligations; hedge losses; and contracts for
differences. As of June 30, 2022, the total net amount of these items is approximately $888 million.
CMP Distribution Rate Case
In an order issued on February 19, 2020, the MPUC authorized an increase in CMP's distribution revenue requirement of
$17 million, or approximately 7.00%, based on an allowed ROE of 9.25% and a 50.00% equity ratio. The rate increase was
effective March 1, 2020. Commencing on March 1, 2020, the MPUC also imposed a 1.00% ROE reduction (to 8.25%) for
management efficiency associated with CMP’s customer service performance following the implementation of its new billing
system in 2017 which would be removed after demonstrating satisfactory customer service performance. In September 2021,
CMP met the 18-month required rolling average satisfactory customer service benchmarks and filed with the MPUC a request
for removal of the management efficiency adjustment, which was approved by the MPUC effective as of its February 18, 2022
order.
The order provided additional funding for staffing increases, vegetation management programs and storm restoration costs,
while retaining the basic tiered structure for storm cost recovery implemented in the 2014 stipulation. The MPUC order also
retained the RDM implemented in 2014. The order denied CMP’s request to increase rates for higher costs associated with
services provided by its affiliates and ordered the initiation of a management audit to evaluate whether CMP's current
management structure, and the management and other services from its affiliates, are appropriate and in the interest of Maine
customers. The management audit was commenced in July 2020 by the MPUC's consultants and culminated with a report
issued by the MPUC’s consultants in July 2021. On February 18, 2022, the MPUC opened a narrowly tailored follow-on
investigation examining how CMP and its customers are affected by decisions made at the CMP corporate parent level about
earnings, capital budgeting, and planning. In this context, the investigation will also examine regulatory approaches and
structures including ratemaking and performance mechanisms. We cannot predict the outcome of this investigation.
In accordance with Chapter 120 of MPUC Rules, on May 26, 2022, CMP filed a nonbinding notice of intent to file a
distribution rate case on or after sixty days from the issuance of the letter. In the notice, CMP signaled its intent to propose a
three-year rate plan, which includes a multi-year capital investment plan to fund investments needed to improve reliability and
resiliency, as well as to continue to improve the customer experience and cost-effectively advance clean energy transformation.
CMP’s notice estimated a revenue change in the range of $45 to $50 million in the first year of the rate plan followed by
18

increases in the range of $25 to $30 million in the second year and $20 to $25 million in the third year. We cannot predict the
outcome of this matter.
NYSEG and RG&E Rate Plans
On November 19, 2020, the NYPSC approved a new three-year rate plan for NYSEG & RG&E (2020 Joint Proposal), with
modifications to the rate increases at the two electric businesses. The effective date of new tariffs was December 1, 2020 with a
make-whole provision back to April 17, 2020. The proposed rates facilitate the companies’ transition to a cleaner energy future
while allowing for important initiatives such as COVID-19 relief for customers and additional funding for vegetation
management, hardening/resiliency and emergency preparedness. The rate plans continue the RAM designed to return or collect
certain defined reconciled revenues and costs, have new depreciation rates and continue existing RDMs for each business. The
2020 Joint Proposal bases delivery revenues on an 8.80% ROE and 48.00% equity ratio; however, for the proposed earnings
sharing mechanism, the equity ratio is the lower of the actual equity ratio or 50.00%. The below table provides a summary of
the approved delivery rate increases and delivery rate percentages, including rate levelization and excluding energy efficiency,
which is a pass-through, for all four businesses:
Year 1 Year 2 Year 3
Rate
Increase
Delivery
Rate %
Rate
Increase
Delivery
Rate %
Rate
Increase
Delivery
Rate %
Utility (Millions) Increase (Millions) Increase (Millions) Increase
NYSEG Electric $ 34 4.6 % $ 46 5.9 % $ 36 4.2 %
NYSEG Gas $ — — % $ 2 0.8 % $ 3 1.6 %
RG&E Electric $ 17 3.8 % $ 14 3.2 % $ 16 3.3 %
RG&E Gas $ — — % $ — — % $ 2 1.3 %
On May 26, 2022, NYSEG and RG&E filed for a new rate plan with the NYPSC. The rate filings are based on test year 2021
financial results adjusted to the rate year May 1, 2023 – April 30, 2024. Since these rate filings were submitted on May 26,
2022, the effective date of new rates, assuming an approximately 11-month suspension period, will be May 1, 2023. NYSEG
and RG&E filed for a one-year rate plan but expressed interest in exploring a multi-year plan during the pendency of the case
(as is the custom in New York). We cannot predict the outcome of these proceedings. In their filings, the following revenue
changes were requested:
Requested Revenue Change
Utility (Millions)
NYSEG Electric $ 274
NYSEG Gas $ 43
RG&E Electric $ 94
RG&E Gas $ 38
UI, CNG, SCG and BGC Rate Plans
In 2016, the Connecticut Public Utilities Regulatory Authority (PURA) approved new distribution rate schedules for The
United Illuminating Company (UI) for three years, which became effective January 1, 2017 and, among other things, provide
for annual tariff increases and an ROE of 9.10% based on a 50.00% equity ratio, continued UI’s existing earnings sharing
mechanism (ESM) pursuant to which UI and its customers share on a 50/50 basis all distribution earnings above the allowed
ROE in a calendar year, continued the existing decoupling mechanism and approved the continuation of the requested storm
reserve. Any dollars due to customers from the ESM continue to be first applied against any storm regulatory asset balance (if
one exists at that time) or refunded to customers through a bill credit if such storm regulatory asset balance does not exist.
In 2017, PURA approved new tariffs for the Southern Connecticut Gas Company (SCG) effective January 1, 2018. The new
tariffs also include an RDM and Distribution Integrity Management Program (DIMP) mechanism, ESM, the amortization of
certain regulatory liabilities (most notably accumulated hardship deferral balances and certain accumulated deferred income
taxes) and tariff increases based on an ROE of 9.25% and an equity ratio of approximately 52.00%. Any dollars due to
customers from the ESM will be first applied against any environmental regulatory asset balance as defined in the settlement
agreement (if one exists at that time) or refunded to customers through a bill credit if such environmental regulatory asset
balance does not exist.
19
In 2018, PURA approved new tariffs for Connecticut Natural Gas Corporation (CNG) effective January 1, 2019 for a three-year
rate plan with annual rate increases. The new tariffs continued the RDM and DIMP mechanism. ESM and tariff increases are
based on an ROE of 9.30% and an equity ratio of 54.00% in 2019, 54.50% in 2020 and 55.00% in 2021.
In 2019, the Massachusetts Department of Public Utilities (DPU) approved new distribution rates for Berkshire Gas Company
(BGC). The distribution rate increase is based on a 9.70% ROE and 54.00% equity ratio. The new tariffs provide for the
implementation of an RDM and pension expense tracker and also provide that BGC will not file to change base distribution
rates to become effective before November 1, 2021.
On June 24, 2022, BGC filed a Settlement Agreement with the Massachusetts Attorney General’s Office (AGO) for DPU
approval. The Settlement Agreement followed BGC’s December 14, 2021 filing of a Notice of Intent to File Rate Schedules.
Following that filing, BGC and the AGO negotiated the Settlement Agreement in lieu of a fully litigated rate case before the
DPU. The Settlement Agreement allows for agreed-upon adjustments to BGC’s revenue requirement as well as various step
increases BGC shall be entitled to on January 1, 2023 and January 1, 2024. The Settlement Agreement provides that it shall be
void unless approved in its entirety by the DPU by November 1, 2022. It provides for the opportunity to increase BGC’s
revenue requirement by as much as $5.6 million over current rates (reflective of a 9.7% ROE and a 54% equity ratio as well as
other stepped adjustments) through January 1, 2024. The Settlement Agreement is now before the DPU for approval. We
cannot predict the outcome of this proceeding.
Connecticut Energy Legislation
On October 7, 2020, the Governor of Connecticut signed into law an energy bill that, among other things, instructs PURA to
revise the rate-making structure in Connecticut to adopt performance-based rates for each electric distribution company,
increases the maximum civil penalties assessable for failures in emergency preparedness, and provides for certain penalties and
reimbursements to customers after storm outages greater than 96 hours and extends rate case timelines.
Pursuant to the legislation, on October 30, 2020, PURA re-opened a docket related to new rate designs and review, expanding
the scope to consider (a) the implementation of an interim rate decrease; (b) low-income rates; and (c) economic development
rates. Separately, UI was due to make its annual RAM filing on March 8, 2021 for the approval of its RAM Rate Components
reconciliations: Generation Services Charges, By-passable Federally Mandated Congestion Costs, System Benefits Charge,
Transmission Adjustment Charge and RDM.
On March 9, 2021, UI, jointly with the Office of the CT Attorney General, the Office of CT Consumer Counsel, DEEP and
PURA’s Office of Education, Outreach, and Enforcement entered into a settlement agreement and filed a motion to approve the
settlement agreement, which addressed issues in both dockets.
In an order dated June 23, 2021, PURA approved the as amended settlement agreement in its entirety and it was executed by the
parties. The settlement agreement includes a contribution by UI of $5 million and provides customers rate credits of $50 million
while allowing UI to collect $52 million in RAM, all over a 22-month period ending April 2023 and also includes a distribution
base rate freeze through April 2023.
Pursuant to the legislation, PURA opened a docket to consider the implementation of the associated customer compensation and
reimbursement provisions in emergency events where customers were without power for more than 96 consecutive hours. On
June 30, 2021, PURA issued a final decision implementing the legislative mandate to create a program pursuant to which
residential customers will receive $25 for each day without power after 96 hours and also receive reimbursement of $250 for
spoiled food and medicine. The decision emphasizes that no costs incurred in connection with this program are recoverable
from customers. The Company is reviewing the requirements of this program and evaluating next steps.
PURA Investigation of the Preparation for and Response to the Tropical Storm Isaias and Connecticut Storm
Reimbursement Legislation
On August 6, 2020, PURA opened a docket to investigate the preparation for and response to Tropical Storm Isaias by the
electric distribution companies in Connecticut including UI. Following hearings and the submission of testimony, PURA issued
a final decision on April 15, 2021, finding that UI “generally met standards of acceptable performance in its preparation and
response to Tropical Storm Isaias," subject to certain exceptions noted in the decision, but ordered a 15-basis point reduction to
UI's ROE in its next rate case to incentivize better performance and indicated that penalties could be forthcoming in the penalty
phase of the proceedings. On June 11, 2021, UI filed an appeal of PURA’s decision with the Connecticut Superior Court.
On May 6, 2021, in connection with its findings in the Tropical Storm Isaias docket, PURA issued a Notice of Violation to UI
for allegedly failing to comply with standards of acceptable performance in emergency preparation or restoration of service in
an emergency and with orders of the Authority, and for violations of accident reporting requirements. PURA assessed a civil
penalty in the total amount of $2 million. PURA held a hearing on this matter and, in an order dated July 14, 2021, reduced the
20
civil penalty to approximately $1 million. UI filed an appeal of PURA’s decision with the Connecticut Superior Court. This
appeal and the appeal of PURA’s decision on the Tropical Storm Isaias docket have been consolidated. We cannot predict the
outcome of these appeals.
Regulatory Assets and Liabilities
The regulatory assets and regulatory liabilities shown in the tables below result from various regulatory orders that allow for the
deferral and/or reconciliation of specific costs. Regulatory assets and regulatory liabilities are classified as current when
recovery or refund in the coming year is allowed or required through a specific order or when the rates related to a specific
regulatory asset or regulatory liability are subject to automatic annual adjustment.
Regulatory assets as of June 30, 2022 and December 31, 2021, respectively, consisted of:
June 30, December 31,
As of 2022 2021
(Millions)
Pension and other post-retirement benefits cost deferrals $ 327 $ 545
Pension and other post-retirement benefits 63 95
Storm costs 548 448
Rate adjustment mechanism 56 68
Revenue decoupling mechanism 53 68
Transmission revenue reconciliation mechanism 13 15
Contracts for differences 64 73
Hardship programs 26 24
Plant decommissioning 1 2
Deferred purchased gas 9 52
Deferred transmission expense 12 13
Environmental remediation costs 254 256
Debt premium 68 71
Unamortized losses on reacquired debt 22 23
Unfunded future income taxes 462 424
Federal tax depreciation normalization adjustment 139 142
Asset retirement obligation 20 20
Deferred meter replacement costs 52 46
COVID-19 cost recovery and late payment surcharge 22 21
Low income arrears forgiveness 36 —
Other 269 241
Total regulatory assets
2,516 2,647
Less: current portion 363 400
Total non-current regulatory assets
$ 2,153 $ 2,247
“Pension and other post-retirement benefits” represent the actuarial losses on the pension and other post-retirement plans that
will be reflected in customer rates when they are amortized and recognized in future pension expenses.
“Pension and other post-retirement benefits cost deferrals” include the difference between actual expense for pension and other
post-retirement benefits and the amount provided for in rates for certain of our regulated utilities. A portion of this balance is
amortized through current rates, the remaining portion will be refunded in future periods through future rate cases.
“Storm costs” for CMP, NYSEG, RG&E and UI are allowed in rates based on an estimate of the routine costs of service
restoration. The companies are also allowed to defer unusually high levels of service restoration costs resulting from major
storms when they meet certain criteria for severity and duration. A portion of this balance is amortized through current rates,
and the remaining portion will be determined through future rate cases.
“Rate adjustment mechanism” represents an interim rate change to return or collect certain defined reconciled revenues and
costs for NYSEG and RG&E following the approval of the Joint Proposal by the NYPSC. The RAM, when triggered, is
implemented in rates on July 1 of each year for return or collection over a twelve-month period.
21
"Revenue decoupling mechanism" represents the mechanism established to disassociate the utility's profits from its delivery/
commodity sales.
"Transmission revenue reconciliation mechanism" reflects differences in actual costs in the rate year from those used to set
rates. This mechanism contains the Annual Transmission True up (ATU), which is recovered over the subsequent June to May
period.
“Contracts for Differences” represent the deferral of unrealized gains and losses on contracts for differences derivative
contracts. The balance fluctuates based upon quarterly market analysis performed on the related derivatives. The amounts,
which do not earn a return, are fully offset by a corresponding derivative asset/liability.
“Hardship Programs” represent hardship customer accounts deferred for future recovery to the extent they exceed the amount in
rates.
“Plant decommissioning” represents decommissioning and demolition expenses related to closing fossil plant facilities - Beebe
& Russell.
“Deferred Purchased Gas” represents the difference between actual gas costs and gas costs collected in rates.
“Deferred Transmission Expense” represents deferred transmission income or expense and fluctuates based upon actual
revenues and revenue requirements.
“Environmental remediation costs” includes spending that has occurred and is eligible for future recovery in customer rates.
Environmental costs are currently recovered through a reserve mechanism whereby projected spending is included in rates with
any variance recorded as a regulatory asset or a regulatory liability. The amortization period will be established in future
proceedings and will depend upon the timing of spending for the remediation costs. It also includes the anticipated future rate
recovery of costs that are recorded as environmental liabilities since these will be recovered when incurred. Because no funds
have yet been expended for the regulatory asset related to future spending, it does not accrue carrying costs and is not included
within rate base.
“Debt premium” represents the regulatory asset recorded to offset the fair value adjustment to the regulatory component of the
non-current debt of UIL at the acquisition date. This amount is being amortized to interest expense over the remaining term of
the related outstanding debt instruments.
“Unamortized losses on reacquired debt” represent deferred losses on debt reacquisitions that will be recovered over the
remaining original amortization period of the reacquired debt.
“Unfunded future income taxes” represent unrecovered federal and state income taxes primarily resulting from regulatory flow
through accounting treatment and are the offset to the unfunded future deferred income tax liability recorded. The income tax
benefits or charges for certain plant related timing differences, such as removal costs, are immediately flowed through to, or
collected from, customers. This amount is being amortized as the amounts related to temporary differences that give rise to the
deferrals are recovered in rates. These amounts are being collected over a period of 46 years, and the NYPSC staff has initiated
an audit, as required, of the unfunded future income taxes and other tax assets to verify the balances.
“Federal tax depreciation normalization adjustment” represents the revenue requirement impact of the difference in the deferred
income tax expense required to be recorded under the IRS normalization rules and the amount of deferred income tax expense
that was included in cost of service for rate years covering 2011 forward. The recovery period in New York is from 25 to 35
years and for CMP 32.5 years beginning in 2020.
“Asset retirement obligations” represents the differences in timing of the recognition of costs associated with our AROs and the
collection of such amounts through rates. This amount is being amortized at the related depreciation and accretion amounts of
the underlying liability.
“Deferred meter replacement costs” represent the deferral of the book value of retired meters which were replaced or are
planned to be replaced by AMI meters. This amount is being amortized over the initial depreciation period of related retired
meters.
"COVID-19 cost recovery and late payment surcharge" represents: a) deferred COVID-19-related costs in the state of
Connecticut based on the order issued by PURA on April 29, 2020, requiring utilities to track COVID-19-related expenses and
lost revenue and create a regulatory asset, and b) deferred lost late payment revenue in the state of New York based on the order
issued by the NYPSC on June 17, 2022, approving deferral and surcharge/sur-credit mechanism to recover/return deferred
balances starting July 1, 2022.
22
“Low-income arrears forgiveness” represents deferred bill credits in the state of New York based on the order issued by the
NYPSC on June 16, 2022, approving deferral of bill credits for low-income customers and recovery of regulatory asset from all
customers over five years for RG&E and three years for NYSEG. Surcharge will start August 1, 2022.
“Other” includes post-term amortization deferrals and various items subject to reconciliation including hedge losses and
deferred property tax.
Regulatory liabilities as of June 30, 2022 and December 31, 2021, respectively, consisted of:
June 30, December 31,
As of 2022 2021
(Millions)
Energy efficiency portfolio standard
$ 34 $ 45
Gas supply charge and deferred natural gas cost
28 7
Pension and other post-retirement benefits cost deferrals
69 73
Carrying costs on deferred income tax bonus depreciation
16 23
Carrying costs on deferred income tax - Mixed Services 263A
5 7
2017 Tax Act
1,286 1,327
Rate Change Levelization
86 99
Revenue decoupling mechanism
17 13
Accrued removal obligations
1,198 1,192
Asset sale gain account
— 2
Economic development
23 26
Positive benefit adjustment
19 22
Theoretical reserve flow thru impact
5 6
Deferred property tax
18 22
Net plant reconciliation
14 16
Debt rate reconciliation
43 49
Rate refund – FERC ROE proceeding
35 35
Transmission congestion contracts
27 23
Merger-related rate credits
11 12
Accumulated deferred investment tax credits
22 24
Asset retirement obligation
18 18
Earning sharing provisions
14 13
Middletown/Norwalk local transmission network service
collections
17 17
Low income programs
25 25
Non-firm margin sharing credits
19 15
New York 2018 winter storm settlement
3 5
Hedge Gains
66 19
Other
301 194
Total regulatory liabilities
3,419 3,329
Less: current portion
447 307
Total non-current regulatory liabilities
$ 2,972 $ 3,022
“Energy efficiency portfolio standard” represents the costs of energy efficiency programs deferred for future recovery to the
extent they exceed the amount in rates. A portion of this balance is amortized through current rates, the remaining portion will
be refunded in future periods through future rate cases. The amortization period in current rates is three years and began in
2020.
23
"Gas supply charge and deferred natural gas cost" reflects the actual costs of purchasing, transporting and storing of natural gas.
Gas supply reconciliation is determined by comparing actual gas supply expenses to the monthly gas cost recoveries in rates.
Prior rate year balances are collected/returned to customers beginning the next calendar year.
“Pension and other postretirement benefits cost deferrals” include the difference between actual expense for pension and other
post-retirement benefits and the amount provided for in rates for certain of our regulated utilities. A portion of this balance is
amortized through current rates, the remaining portion will be refunded in future periods through future rate cases.
“Carrying costs on deferred income tax bonus depreciation” represent the carrying costs benefit of increased accumulated
deferred income taxes created by the change in tax law allowing bonus depreciation. A portion of this balance is amortized
through current rates, the remaining portion will be refunded in future periods through future rate cases. The amortization
period in current rates is three years and began in 2020.
"Carrying costs on deferred income tax - Mixed Services 263(a)" represent the carrying costs benefit of increased accumulated
deferred income taxes created by Section 263 (a) IRC. A portion of this balance is amortized through current rates, the
remaining portion will be refunded in future periods through future rate cases. The amortization period in current rates is three
years and began in 2020.
“2017 Tax Act” represents the impact from remeasurement of deferred income tax balances as a result of the Tax Act enacted
by the U.S. federal government on December 22, 2017. Reductions in accumulated deferred income tax balances due to the
reduction in the corporate income tax rates from 35% to 21% under the provisions of the Tax Act will result in amounts
previously and currently collected from utility customers for these deferred taxes to be refundable to such customers, generally
through reductions in future rates. The NYPSC, MPUC, PURA and DPU have instituted separate proceedings in New York,
Maine, Connecticut and Massachusetts, respectively, to review and address the implications associated with the Tax Act on the
utilities providing service in such states.
"Rate change levelization" adjusts the New York delivery rate increases across the three-year plan to avoid unnecessary spikes
and offsetting dips in customer rates. A portion of this balance is amortized through current rates, the remaining portion will be
refunded in future periods through future rate cases. The amortization period in current rates is five years and began in 2020.
"Revenue decoupling mechanism" represents the mechanism established to disassociate the utility's profits from its delivery/
commodity sales.
“Accrued removal obligations” represent the differences between asset removal costs recorded and amounts collected in rates
for those costs. The amortization period is dependent upon the asset removal costs of underlying assets and the life of the utility
plant.
“Asset sale gain account” represents the net gain on the sale of certain assets that will be used for the future benefit of
customers. The amortization period in current rates is three years for NYSEG and two years for RG&E and began in 2020.
“Economic development” represents the economic development program, which enables NYSEG and RG&E to foster
economic development through attraction, expansion and retention of businesses within its service territory. If the level of
actual expenditures for economic development allocated to NYSEG and RG&E varies in any rate year from the level provided
for in rates, the difference is refunded to customers. A portion of this balance is amortized through current rates, the remaining
portion will be refunded in future periods through future rate cases. The amortization period in current rates is three years and
began in 2020.
“Positive benefit adjustment” resulted from Iberdrola’s 2008 acquisition of AVANGRID (formerly Energy East Corporation).
This is being used to moderate increases in rates. A portion of this balance is amortized through current rates, the remaining
portion will be refunded in future periods through future rate cases. The amortization period in current rates is three years and
began in 2020.
“Theoretical reserve flow thru impact” represents the differences from the rate allowance for applicable federal and state flow
through impacts related to the excess depreciation reserve amortization. It also represents the carrying cost on the differences. A
portion of this balance is amortized through current rates, the remaining portion will be refunded in future periods through
future rate cases. The amortization period in current rates is three to five years and began in 2020.
"Deferred property tax" represents the difference between actual expense for property taxes recoverable from customers and the
amount provided for in rates. A portion of this balance is amortized through current rates, the remaining portion will be
refunded in future periods through future rate cases. The amortization period in current rates is five years and began in 2020.
24
"Net plant reconciliation" represents the reconciliation of the actual electric and gas net plant and book depreciation to the
targets set forth in the 2020 Joint Proposal. A portion of this balance is amortized through current rates, the remaining portion
will be refunded in future periods through future rate cases. The amortization period in current rates is five years and began in
2020.
"Debt rate reconciliation" represents the over/under collection of costs related to debt instruments identified in the rate case.
Costs would include interest, commissions and fees versus amounts included in rates.
"Rate refund - FERC ROE proceeding" represents the reserve associated with the FERC proceeding around the base return on
equity (ROE) reflected in ISO New England, Inc.’s (ISO-NE) open access transmission tariff (OATT). See Note 8 for more
details.
"Transmission congestion contracts" represents deferral of the Nine Mile 2 Nuclear Plant transmission congestion contract at
RG&E. A portion of this balance is amortized through current rates, the remaining portion will be refunded in future periods
through future rate cases. The amortization period in current rates is five years and began in 2020.
“Merger-related rate credits” resulted from the acquisition of UIL. This is being used to moderate increases in rates. During
both the three and six months ended June 30, 2022 and 2021, $0 and $1 million, respectively, of rate credits were applied
against customer bills.
"Asset retirement obligation" represents the differences in timing of the recognition of costs associated with our AROs and the
collection of such amounts through rates. This amount is being amortized at the related depreciation and accretion amounts of
the underlying liability.
"Earning sharing provisions" represents the annual earnings over the earnings sharing threshold. A portion of this balance is
amortized through current rates, the remaining portion will be refunded in future periods through future rate cases.
"Middletown/Norwalk local transmission network service collections" represents allowance for funds used during construction
of the Middletown/Norwalk transmission line, which is being amortized over the useful life of the project.
“Low income programs” represent various hardship and payment plan programs approved for recovery.
“New York 2018 winter storm settlement” represents the settlement amount with the NYPSC following the comprehensive
investigation of New York’s major utility companies’ preparation and response to March 2018 storms. The balance is being
amortized through current rates over an amortization period of three years, beginning in 2020.
“Hedge gains” represents the deferred fair value gains on electric and gas hedge contracts.
“Other” includes cost of removal being amortized through rates and various items subject to reconciliation.
Note 6. Fair Value of Financial Instruments and Fair Value Measurements
We determine the fair value of our derivative assets and liabilities and non-current equity investments associated with
Networks’ activities utilizing market approach valuation techniques:
• Our equity and other investments consist of Rabbi Trusts for deferred compensation plans and a supplemental
retirement benefit life insurance trust. The Rabbi Trusts primarily include equity securities, fixed income and money
market funds. We measure the fair value of our Rabbi Trust portfolio using observable, unadjusted quoted market
prices in active markets for identical assets and include the measurements in Level 1. We measure the fair value of the
supplemental retirement benefit life insurance trust based on quoted prices in the active markets for the various funds
within which the assets are held and include the measurement in Level 2.
• NYSEG and RG&E enter into electric energy derivative contracts to hedge the forecasted purchases required to serve
their electric load obligations. They hedge their electric load obligations using derivative contracts that are settled based
upon Locational Based Marginal Pricing published by the NYISO. NYSEG and RG&E hedge approximately 70% of
their electric load obligations using contracts for a NYISO location where an active market exists. The forward market
prices used to value the companies’ open electric energy derivative contracts are based on quoted prices in active
markets for identical assets or liabilities with no adjustment required and therefore we include the fair value
measurements in Level 1.
• NYSEG and RG&E enter into natural gas derivative contracts to hedge their forecasted purchases required to serve
their natural gas load obligations. NYSEG and RG&E hedge up to approximately 55% of its forecasted winter demand
through the use of financial transactions and storage withdrawals. The forward market prices used to value open natural
25
gas derivative contracts are exchange-based prices for the identical derivative contracts traded actively on the
Intercontinental Exchange (ICE). We include the fair value measurements in Level 1 because we use prices quoted in
an active market.
• NYSEG, RG&E and CMP enter into fuel derivative contracts to hedge their unleaded and diesel fuel requirements for
their fleet vehicles. Exchange-based forward market prices are used, but because an unobservable basis adjustment is
added to the forward prices, we include the fair value measurement for these contracts in Level 3.
• UI enters into CfDs, which are marked-to-market based on a probability-based expected cash flow analysis that is
discounted at risk-free interest rates and an adjustment for non-performance risk using credit default swap rates. We
include the fair value measurement for these contracts in Level 3 (See Note 7 for further discussion of CfDs).
We determine the fair value of our derivative assets and liabilities associated with Renewables activities utilizing market
approach valuation techniques. Exchange-traded transactions, such as New York Mercantile Exchange (NYMEX) futures
contracts, that are based on quoted market prices in active markets for identical products with no adjustment are included in fair
value Level 1. Contracts with delivery periods of two years or less which are traded in active markets and are valued with or
derived from observable market data for identical or similar products such as over-the-counter NYMEX, foreign exchange
swaps, and fixed price physical and basis and index trades are included in fair value Level 2. Contracts with delivery periods
exceeding two years or that have unobservable inputs or inputs that cannot be corroborated with market data for identical or
similar products are included in fair value Level 3. The unobservable inputs include historical volatilities and correlations for
tolling arrangements and extrapolated values for certain power swaps. The valuation for this category is based on our judgments
about the assumptions market participants would use in pricing the asset or liability since limited market data exists.
We determine the fair value of our interest rate derivative instruments based on a model whose inputs are observable, such as
the London Interbank Offered Rate (LIBOR) forward interest rate curves. We include the fair value measurement for these
contracts in Level 2 (See Note 7 for further discussion of interest rate contracts).
We determine the fair value of our foreign currency exchange derivative instruments based on current exchange rates compared
to the rates at inception of the hedge. We include the fair value measurement for these contracts in Level 2.
The carrying amounts for cash and cash equivalents, restricted cash, accounts receivable, accounts payable, notes payable, lease
obligations and interest accrued approximate fair value.
As of both June 30, 2022 and December 31, 2021 restricted cash was $3 million, and is included in "Other Assets" on our
condensed consolidated balance sheets.
26
The financial instruments measured at fair value as of June 30, 2022 and December 31, 2021, respectively, consisted of:
As of June 30, 2022 Level 1 Level 2 Level 3 Netting Total
(Millions)
Equity investments with readily determinable fair values
$ 32 $ 13 $ — $ — $ 45
Derivative assets
Derivative financial instruments - power
$ 78 $ 68 $ 119 $ (123) $ 142
Derivative financial instruments - gas
11 69 5 (72) 13
Contracts for differences
— — 2 — 2
Derivative financial instruments - Other
— 69 1 — 70
Total
$ 89 $ 206 $ 127 $ (195) $ 227
Derivative liabilities
Derivative financial instruments - power
$ (29) $ (186) $ (210) $ 282 $ (143)
Derivative financial instruments - gas
— (52) (2) 52 (2)
Contracts for differences
— — (66) — (66)
Derivative financial instruments - Other
— (84) — — (84)
Total
$ (29) $ (322) $ (278) $ 334 $ (295)
As of December 31, 2021 Level 1 Level 2 Level 3 Netting Total
(Millions)
Equity investments with readily determinable fair values
$ 45 $ 15 $ — $ — $ 60
Derivative assets
Derivative financial instruments - power
$ 31 $ 39 $ 85 $ (78) $ 77
Derivative financial instruments - gas
4 34 9 (32) 15
Contracts for differences
— — 2 — 2
Derivative financial instruments - Other
— — — — —
Total
$ 35 $ 73 $ 96 $ (110) $ 94
Derivative liabilities
Derivative financial instruments - power
$ (16) $ (137) $ (90) $ 176 $ (67)
Derivative financial instruments - gas
(1) (22) — 18 (5)
Contracts for differences
— — (75) — (75)
Derivative financial instruments - Other
— (77) — — (77)
Total
$ (17) $ (236) $ (165) $ 194 $ (224)
27
The reconciliation of changes in the fair value of financial instruments based on Level 3 inputs for the three and six months
ended June 30, 2022 and 2021, respectively, is as follows:
Three Months Ended June 30, Six Months Ended June 30,
(Millions) 2022 2021 2022 2021
Fair Value Beginning of Period,
$ (124) $ 1 $ (69) $ 13
Gains recognized in operating revenues
14 24 52 35
(Losses) recognized in operating revenues
(22) (15) (62) (19)
Total gains recognized in operating revenues
(8) 9 (10) 16
Gains recognized in OCI
1 — 3 1
(Losses) recognized in OCI
(29) (30) (92) (47)
Total (losses) recognized in OCI
(28) (30) (89) (46)
Net change recognized in regulatory assets and liabilities
5 4 9 5
Purchases
— (4) (1) (4)
Settlements
4 — 9 (4)
Fair Value as of June 30,
$ (151) $ (20) $ (151) $ (20)
Gains for the period included in operating revenues attributable to
the change in unrealized gains relating to financial instruments
still held at the reporting date $ (8) $ 9 $ (10) $ 16
Level 3 Fair Value Measurement
The table below illustrates the significant sources of unobservable inputs used in the fair value measurement of our Level 3
derivatives and the variability in prices for those transactions classified as Level 3 derivatives.
As of June 30, 2022
Index Avg. Max. Min.
NYMEX ($/MMBtu) $ 4.01 $ 9.40 $ 2.27
AECO ($/MMBtu) $ 3.01 $ 10.80 $ 1.53
Ameren ($/MWh) $ 44.42 $ 225.62 $ 18.01
COB ($/MWh) $ 55.56 $ 236.05 $ 9.15
ComEd ($/MWh) $ 40.30 $ 222.49 $ 14.98
ERCOT N hub ($/MWh) $ 45.15 $ 272.25 $ 13.66
ERCOT S hub ($/MWh) $ 43.67 $ 268.72 $ 13.88
Indiana hub ($/MWh) $ 46.76 $ 230.14 $ 20.74
Mid C ($/MWh) $ 52.39 $ 229.90 $ 5.15
Minn hub ($/MWh) $ 39.47 $ 183.54 $ 15.23
NoIL hub ($/MWh) $ 40.06 $ 222.18 $ 14.64
PJM W hub ($/MWh) $ 46.46 $ 227.60 $ 17.78
Our Level 3 valuations primarily consist of NYMEX gas and fixed price power swaps with delivery periods extending through
2024 and 2032, respectively. The gas swaps are used to hedge uncontracted wind positions. The power swaps are used to hedge
uncontracted wind production in the West and Midwest.
We considered the measurement uncertainty regarding the Level 3 gas and power positions to changes in the valuation inputs.
Given the nature of the transactions in Level 3, the only material input to the valuation is the market price of gas or power for
transactions with delivery periods exceeding two years. The fixed price power swaps are economic hedges of future power
generation, with decreases in power prices resulting in unrealized gains and increases in power prices resulting in unrealized
losses. The gas swaps are economic hedges of uncontracted generation, with decreases in gas prices resulting in unrealized
gains and increases in gas prices resulting in unrealized losses. As all transactions are economic hedges of the underlying
position, any changes in the fair value of these transactions will be offset by changes in the anticipated purchase/sales price of
the underlying commodity.
28
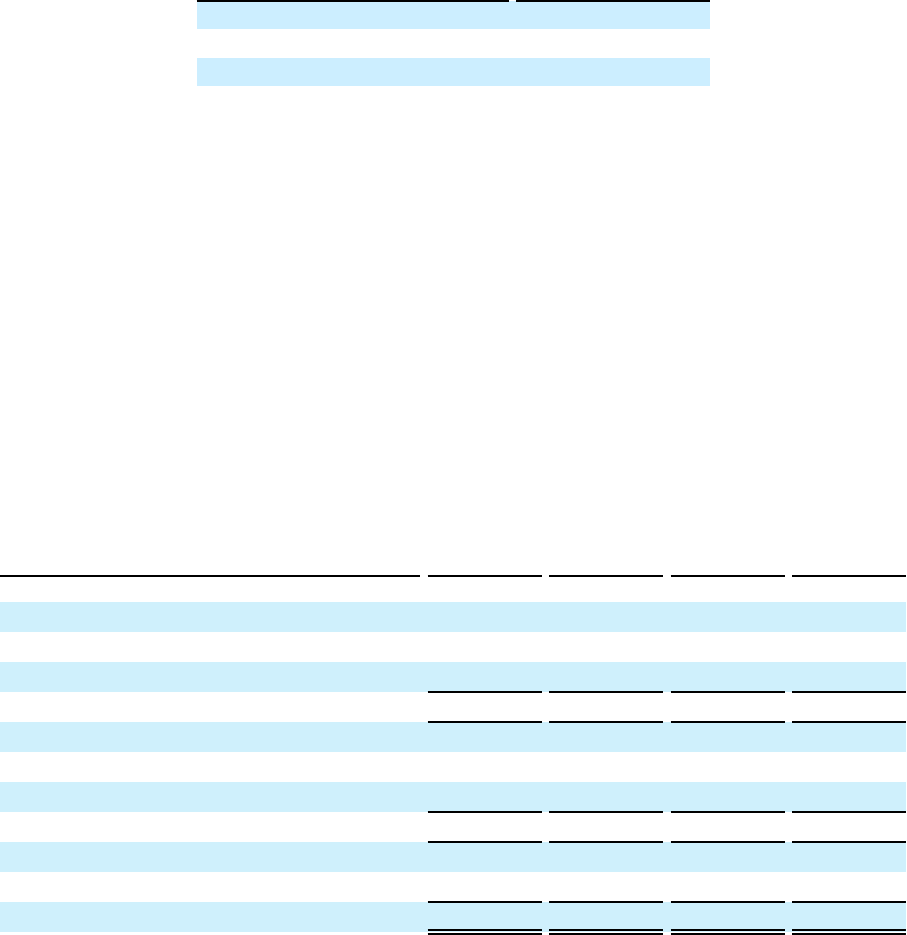
Two elements of the analytical infrastructure employed in valuing transactions are the price curves used in the calculation of
market value and the models themselves. We maintain and document authorized trading points and associated forward price
curves, and we develop and document models used in valuation of the various products.
Transactions are valued in part on the basis of forward price, correlation and volatility curves. We maintain and document
descriptions of these curves and their derivations. Forward price curves used in valuing the transactions are applied to the full
duration of the transaction.
The determination of fair value of the CfDs (see Note 7 for further details on CfDs) was based on a probability-based expected
cash flow analysis that was discounted at risk-free interest rates, as applicable, and an adjustment for non-performance risk
using credit default swap rates. Certain management assumptions were required, including development of pricing that extends
over the term of the contracts. We believe this methodology provides the most reasonable estimates of the amount of future
discounted cash flows associated with the CfDs. Additionally, on a quarterly basis, we perform analytics to ensure that the fair
value of the derivatives is consistent with changes, if any, in the various fair value model inputs. Significant isolated changes in
the risk of non-performance, the discount rate or the contract term pricing would result in an inverse change in the fair value of
the CfDs. Additional quantitative information about Level 3 fair value measurements of the CfDs is as follows:
Range at
Unobservable Input June 30, 2022
Risk of non-performance
1.01% - 1.31%
Discount rate
2.85% - 2.88%
Forward pricing ($ per KW-month)
$2.00 - $3.80
Fair Value of Debt
As of June 30, 2022 and December 31, 2021, debt consisted of first mortgage bonds, unsecured pollution control notes and
other various non-current debt securities. The estimated fair value of debt was $7,904 million and $9,155 million as of June 30,
2022 and December 31, 2021, respectively. The estimated fair value was determined, in most cases, by discounting the future
cash flows at market interest rates. The interest rates used to make these calculations take into account the credit ratings of the
borrowers in each case. All debt is considered Level 2 within the fair value hierarchy.
Note 7. Derivative Instruments and Hedging
Our operating and financing activities are exposed to certain risks, which are managed by using derivative instruments. All
derivative instruments are recognized as either assets or liabilities at fair value on our condensed consolidated balance sheets in
accordance with the accounting requirements concerning derivative instruments and hedging activities.
(a) Networks activities
The tables below present Networks' derivative positions as of June 30, 2022 and December 31, 2021, respectively, including
those subject to master netting agreements and the location of the net derivative positions on our condensed consolidated
balance sheets:
As of June 30, 2022 Current Assets
Noncurrent
Assets
Current
Liabilities
Noncurrent
Liabilities
(Millions)
Not designated as hedging instruments
Derivative assets
$ 84 $ 6 $ 18 $ 4
Derivative liabilities
(18) (5) (33) (62)
66 1 (15) (58)
Designated as hedging instruments
Derivative assets
1 — — —
Derivative liabilities
— — — —
1 — — —
Total derivatives before offset of cash collateral
67 1 (15) (58)
Cash collateral receivable
— — — 6
Total derivatives as presented in the balance sheet
$ 67 $ 1 $ (15) $ (52)
29

As of December 31, 2021 Current Assets
Noncurrent
Assets
Current
Liabilities
Noncurrent
Liabilities
(Millions)
Not designated as hedging instruments
Derivative assets
$ 29 $ 7 $ 12 $ 4
Derivative liabilities
(12) (4) (27) (64)
17 3 (15) (60)
Designated as hedging instruments
Derivative assets
— — — —
Derivative liabilities
— — (1) —
— — (1) —
Total derivatives before offset of cash collateral
17 3 (16) (60)
Cash collateral receivable
— — — —
Total derivatives as presented in the balance sheet
$ 17 $ 3 $ (16) $ (60)
The net notional volumes of the outstanding derivative instruments associated with Networks' activities as of June 30, 2022 and
December 31, 2021, respectively, consisted of:
June 30, December 31,
As of 2022 2021
(Millions)
Wholesale electricity purchase contracts (MWh)
5.2 5.7
Natural gas purchase contracts (Dth)
8.4 9.4
Fleet fuel purchase contracts (Gallons)
0.7 2.0
Derivatives not designated as hedging instruments
NYSEG and RG&E have an electric commodity charge that passes costs for the market price of electricity through rates. We
use electricity contracts, both physical and financial, to manage fluctuations in electricity commodity prices in order to provide
price stability to customers. We include the cost or benefit of those contracts in the amount expensed for electricity purchased
when the related electricity is sold. We record changes in the fair value of electric hedge contracts to derivative assets and/or
liabilities with an offset to regulatory assets and/or regulatory liabilities, in accordance with the accounting requirements
concerning regulated operations.
NYSEG and RG&E have purchased gas adjustment clauses that allow us to recover through rates any changes in the market
price of purchased natural gas, substantially eliminating our exposure to natural gas price risk. NYSEG and RG&E use natural
gas futures and forwards to manage fluctuations in natural gas commodity prices to provide price stability to customers. We
include the cost or benefit of natural gas futures and forwards in the commodity cost that is passed on to customers when the
related sales commitments are fulfilled. We record changes in the fair value of natural gas hedge contracts to derivative assets
and/or liabilities with an offset to regulatory assets and/or regulatory liabilities in accordance with the accounting requirements
for regulated operations.
30

The amounts for electricity hedge contracts and natural gas hedge contracts recognized in regulatory liabilities and assets as of
June 30, 2022 and December 31, 2021 and amounts reclassified from regulatory assets and liabilities into income for the three
and six months ended June 30, 2022 and 2021 are as follows:
(Millions)
Loss or Gain Recognized
in Regulatory Assets/
Liabilities
Location of Loss
(Gain) Reclassified
from Regulatory Assets/
Liabilities into Income
Loss (Gain) Reclassified from Regulatory Assets/
Liabilities into Income
As of
Three Months Ended
June 30,
Six Months Ended
June 30,
June 30, 2022 Electricity
Natural
Gas 2022 Electricity
Natural
Gas Electricity
Natural
Gas
Regulatory assets $ 6 $ —
Purchased power, natural
gas and fuel used $ (19) $ — $ (64) $ (9)
Regulatory liabilities $ (56) $ (10)
December 31, 2021 2021
Regulatory assets $ — $ —
Purchased power, natural
gas and fuel used $ 8 $ — $ 10 $ (1)
Regulatory liabilities $ (16) $ (3)
Pursuant to a PURA order, UI and Connecticut’s other electric utility, CL&P, each executed two long-term CfDs with certain
incremental capacity resources, each of which specifies a capacity quantity and a monthly settlement that reflects the difference
between a forward market price and the contract price. The costs or benefits of each contract will be paid by or allocated to
customers and will be subject to a cost-sharing agreement between UI and CL&P pursuant to which approximately 20% of the
cost or benefit is borne by or allocated to UI customers and approximately 80% is borne by or allocated to CL&P customers.
PURA has determined that costs associated with these CfDs will be fully recoverable by UI and CL&P through electric rates,
and UI has deferred recognition of costs (a regulatory asset) or obligations (a regulatory liability), including carrying costs. For
those CfDs signed by CL&P, UI records its approximate 20% portion pursuant to the cost-sharing agreement noted above. As
of June 30, 2022, UI has recorded a gross derivative asset of $2 million ($0 of which is related to UI’s portion of the CfD
signed by CL&P), a regulatory asset of $64 million, a gross derivative liability of $66 million ($64 million of which is related to
UI’s portion of the CfD signed by CL&P) and a regulatory liability of $0. As of December 31, 2021, UI had recorded a gross
derivative asset of $2 million ($0 of which is related to UI’s portion of the CfD signed by CL&P), a regulatory asset of $73
million, a gross derivative liability of $75 million ($72 million of which is related to UI’s portion of the CfD signed by CL&P)
and a regulatory liability of $0.
The unrealized gains and losses from fair value adjustments to these derivatives, which are recorded in regulatory assets, for the
three and six months ended June 30, 2022 and 2021, respectively, were as follows:
Three Months Ended June 30, Six Months Ended June 30,
2022 2021 2022 2021
(Millions)
Derivative assets
$ — $ — $ — $ —
Derivative liabilities
$ 5 $ 4 $ 9 $ 5
31
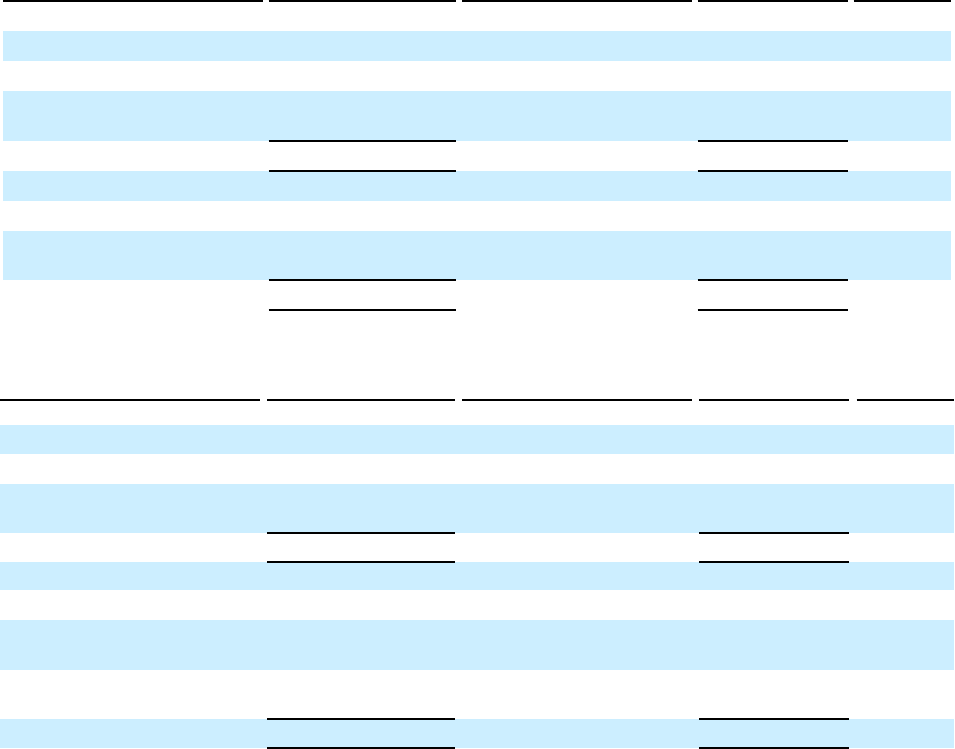
Derivatives designated as hedging instruments
The effect of derivatives in cash flow hedging relationships on Other Comprehensive Income (OCI) and income for the three
and six months ended June 30, 2022 and 2021, respectively, consisted of:
Three Months Ended June 30,
Gain Recognized
in OCI on Derivatives (a)
Location of Loss Reclassified
from Accumulated
OCI into Income
Loss Reclassified
from Accumulated
OCI into Income
Total
amount per
Income
Statement
(Millions)
2022
Interest rate contracts $ — Interest expense $ 1 $ 79
Commodity contracts —
Purchased power, natural
gas and fuel used (1) 440
Total $ — $ —
2021
Interest rate contracts $ — Interest expense $ 1 $ 75
Foreign currency exchange
contracts 1 —
Total $ 1 $ 1
Six Months Ended June 30,
Gain (Loss) Recognized
in OCI on Derivatives (a)
Location of Loss Reclassified
from Accumulated
OCI into Income
Loss Reclassified
from Accumulated
OCI into Income
Total
amount per
Income
Statement
(Millions)
2022
Interest rate contracts $ — Interest expense $ 2 $ 150
Commodity contracts 2
Purchased power, natural
gas and fuel used (2) 1,181
Total $ 2 $ —
2021
Interest rate contracts $ — Interest expense $ 2 $ 148
Commodity contracts 1
Purchased power, natural
gas and fuel used — 766
Foreign currency exchange
contracts (3) —
Total $ (2) $ 2
(a) Changes in accumulated OCI are reported on a pre-tax basis.
As of June 30, 2022 and December 31, 2021, the net loss in accumulated OCI related to previously settled forward starting
swaps and accumulated amortization was $45 million and $47 million, respectively. For all the three and six months ended
June 30, 2022 and 2021, Networks recorded net derivative losses related to discontinued cash flow hedges of $1 million and $2
million, respectively. Networks will amortize approximately $2 million of discontinued cash flow hedges for the remainder of
2022.
Unrealized gains of $1 million on hedge derivatives are reported in OCI because the forecasted transactions are considered to be
probable as of June 30, 2022. Networks expects $1 million of those gains will be reclassified into earnings within the next
twelve months. The maximum length of time over which we are hedging our exposure to the variability in future cash flows for
forecasted fleet fuel transactions is twelve months.
(b) Renewables activities
Renewables sells fixed-price gas and power forwards to hedge our merchant wind assets from declining commodity prices for
our Renewables business. Renewables also purchases fixed-price gas and basis swaps and sells fixed-price power in the forward
market to hedge the spark spread or heat rate of our merchant thermal assets and enters into tolling arrangements to sell the
output of its thermal generation facilities.
Renewables has proprietary trading operations that enter into fixed-price power and gas forwards in addition to basis swaps.
The intent is to speculate on fixed-price commodity and basis volatility in the U.S. commodity markets.
32

Renewables will periodically designate derivative contracts as cash flow hedges for both its thermal and wind portfolios. The
fair value changes are recorded in OCI. For thermal operations, Renewables will periodically designate both fixed-price
NYMEX gas contracts and natural gas basis swaps that hedge the fuel requirements of its Klamath Plant in Klamath, Oregon.
Renewables will also designate fixed-price power swaps at various locations in the U.S. market to hedge future power sales
from its Klamath facility and various wind farms.
The net notional volumes of outstanding derivative instruments associated with Renewables' activities as of June 30, 2022 and
December 31, 2021, respectively, consisted of:
June 30, December 31,
As of 2022 2021
(MWh/Dth in millions)
Wholesale electricity purchase contracts
3 4
Wholesale electricity sales contracts
9 10
Natural gas and other fuel purchase contracts
14 20
Financial power contracts
8 9
Basis swaps – purchases
28 30
The fair values of derivative contracts associated with Renewables' activities as of June 30, 2022 and December 31, 2021,
respectively, consisted of:
June 30, December 31,
As of 2022 2021
(Millions)
Wholesale electricity purchase contracts
$ 90 $ 36
Wholesale electricity sales contracts
(160) (77)
Natural gas and other fuel purchase contracts
1 6
Financial power contracts
14 35
Total
$ (55) $ —
On May 27, 2021, Renewables entered into a forward interest rate swap, with a total notional amount of $935 million, to hedge
the issuance of forecasted variable rate debt. The forward interest rate swap is designated and qualifies as a cash flow hedge. As
part of the financial close of Vineyard Wind 1 described in Note 19, this hedge was novated to the lending institutions and the
notional value changed to $956 million. As of June 30, 2022 and December 31, 2021, the fair value of the interest rate swap
was $69 million and $(58) million, respectively, as a non-current asset and non-current liability. The gain or loss on the interest
rate swap is reported as a component of accumulated OCI and will be reclassified into earnings in the period or periods during
which the related interest expense on the debt is incurred.
The tables below present Renewables' derivative positions as of June 30, 2022 and December 31, 2021, respectively, including
those subject to master netting agreements and the location of the net derivative position on our condensed consolidated balance
sheets:
As of June 30, 2022
Current
Assets
Noncurrent
Assets
Current
Liabilities
Noncurrent
Liabilities
(Millions)
Not designated as hedging instruments
Derivative assets
$ 75 $ 73 $ 88 $ 16
Derivative liabilities
(26) (35) (106) (21)
49 38 (18) (5)
Designated as hedging instruments
Derivative assets
4 70 2 4
Derivative liabilities
(2) — (141) (120)
2 70 (139) (116)
Total derivatives before offset of cash collateral
51 108 (157) (121)
Cash collateral receivable
— — 71 62
Total derivatives as presented in the balance sheet
$ 51 $ 108 $ (86) $ (59)
33
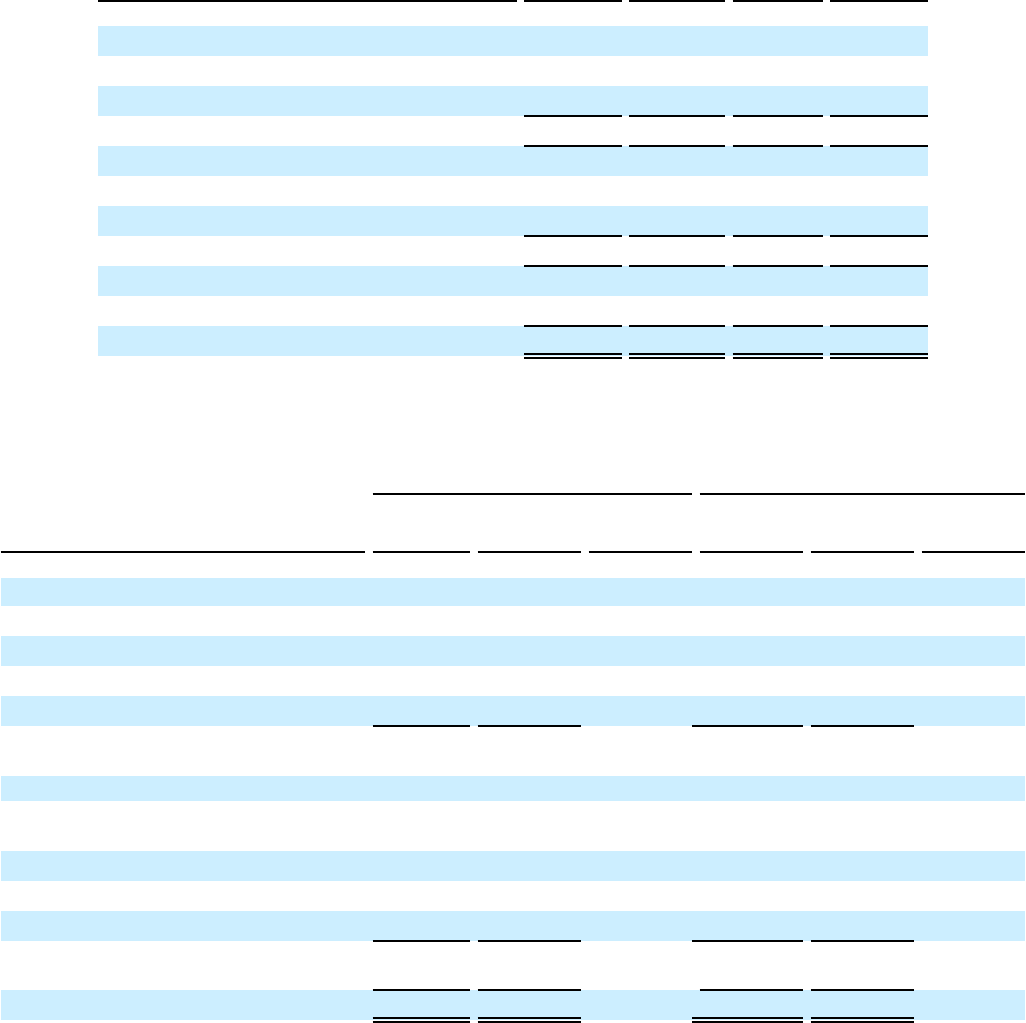
As of December 31, 2021
Current
Assets
Noncurrent
Assets
Current
Liabilities
Noncurrent
Liabilities
(Millions)
Not designated as hedging instruments
Derivative assets
$ 29 $ 70 $ 52 $ 9
Derivative liabilities
(11) (14) (65) (11)
18 56 (13) (2)
Designated as hedging instruments
Derivative assets
— — 5 6
Derivative liabilities
— — (67) (142)
— — (62) (136)
Total derivatives before offset of cash collateral
18 56 (75) (138)
Cash collateral receivable
— — 27 57
Total derivatives as presented in the balance sheet $ 18 $ 56 $ (48) $ (81)
Derivatives not designated as hedging instruments
The effects of trading and non-trading derivatives associated with Renewables' activities for the three and six months ended
June 30, 2022, consisted of:
Three Months Ended June 30, 2022 Six Months Ended June 30, 2022
Trading Non-trading
Total amount
per income
statement Trading Non-trading
Total amount
per income
statement
(Millions)
Operating Revenues
Wholesale electricity purchase contracts $ (8) $ (3) $ 1 $ —
Wholesale electricity sales contracts 7 30 6 (10)
Financial power contracts — (20) (2) (41)
Financial and natural gas contracts 1 4 — (21)
Total gain (loss) included in operating
revenues $ — $ 11 $ 1,794 $ 5 $ (72) $ 3,927
Purchased power, natural gas and fuel
used
Wholesale electricity purchase contracts $ — $ 16 $ — $ 53
Financial power contracts — (2) — (1)
Financial and natural gas contracts — (16) — 21
Total (loss) gain included in purchased
power, natural gas and fuel used $ — $ (2) $ 440 $ — $ 73 $ 1,181
Total Gain $ — $ 9 $ 5 $ 1
34

The effects of trading and non-trading derivatives associated with Renewables' activities for the three and six months ended
June 30, 2021, consisted of:
Three Months Ended June 30, 2021 Six Months Ended June 30, 2021
Trading Non-trading
Total amount
per income
statement Trading Non-trading
Total amount
per income
statement
(Millions)
Operating Revenues
Wholesale electricity purchase contracts $ 7 $ (1) $ 14 $ (1)
Wholesale electricity sales contracts — (20) — (37)
Financial power contracts (4) (40) (9) (56)
Financial and natural gas contracts — (13) — (17)
Total (loss) gain included in operating
revenues $ 3 $ (74) $ 1,477 $ 5 $ (111) $ 3,443
Purchased power, natural gas and fuel
used
Wholesale electricity purchase contracts $ — $ 27 $ — $ 37
Financial power contracts — 5 — 6
Financial and natural gas contracts — 19 — 23
Total gain included in purchased power,
natural gas and fuel used $ — $ 51 $ 265 $ — $ 66 $ 766
Total Gain (Loss) $ 3 $ (23) $ 5 $ (45)
Derivatives designated as hedging instruments
The effect of derivatives in cash flow hedging relationships on accumulated OCI and income for the three and six months ended
June 30, 2022 and 2021, respectively, consisted of:
Three Months Ended June 30,
(Loss) Gain
Recognized in OCI on
Derivatives (a)
Location of (Gain)
Reclassified from
Accumulated OCI into
Income
(Gain) Reclassified
from Accumulated OCI
into Income
Total amount per
Income Statement
(Millions)
2022
Interest rate contracts 71 Interest Expense — $ 79
Commodity contracts (18) Operating revenues 8 $ 1,794
Total $ 53 $ 8
2021
Interest rate contracts (32) Interest Expense — $ 75
Commodity contracts (64) Operating revenues (5) $ 1,477
Total $ (96) $ (5)
35

Six Months Ended June 30,
(Loss) Gain
Recognized in OCI on
Derivatives (a)
Location of (Gain)
Reclassified from
Accumulated OCI into
Income
(Gain) Reclassified
from Accumulated OCI
into Income
Total amount per
Income Statement
(Millions)
2022
Interest rate contracts 127 Interest Expense — $ 150
Commodity contracts (130) Operating revenues 19 $ 3,927
Total
$ (3) $ 19
2021
Interest rate contracts (32) Interest Expense — $ 148
Commodity contracts (92) Operating revenues (6) $ 3,443
Total
$ (124) $ (6)
(a) Changes in OCI are reported on a pre-tax basis.
Amounts are reclassified from accumulated OCI into income in the period during which the transaction being hedged affects
earnings or when it becomes probable that a forecasted transaction being hedged would not occur. Notwithstanding future
changes in prices, approximately $134 million of losses included in accumulated OCI at June 30, 2022, are expected to be
reclassified into earnings within the next twelve months. For all of the three and six months ended June 30, 2022 and 2021, we
did not record any net derivative losses related to discontinued cash flow hedges.
(c) Interest rate contracts
AVANGRID uses financial derivative instruments from time to time to alter its fixed and floating rate debt balances or to hedge
fixed rates in anticipation of future fixed rate issuances.
As of June 30, 2022 and December 31, 2021, the net loss in accumulated OCI related to previously settled interest rate contracts
was $43 million and $48 million, respectively. For all the three and six months ended June 30, 2022 and 2021, we amortized
into income $3 million and $5 million, respectively, of the loss related to settled interest rate contracts. We will amortize
approximately $5 million of the net loss on the interest rate contracts for the remainder of 2022.
The effect of derivatives in cash flow hedging relationships on accumulated OCI for the three and six months ended June 30,
2022 and 2021, respectively, consisted of:
Three Months Ended June 30,
Gain Recognized in
OCI on Derivatives (a)
Location of Loss Reclassified
from Accumulated OCI into
Income
Loss Reclassified
from Accumulated
OCI into Income
Total amount per
Income Statement
(Millions)
2022
Interest rate contracts $ — Interest expense $ 3 $ 79
2021
Interest rate contracts $ — Interest expense $ 3 $ 75
Six Months Ended June 30,
(Loss) Recognized in
OCI on Derivatives (a)
Location of Loss Reclassified
from Accumulated OCI into
Income
Loss Reclassified
from Accumulated
OCI into Income
Total amount per
Income Statement
(Millions)
2022
Interest rate contracts $ — Interest expense $ 5 $ 150
2021
Interest rate contracts Interest expense $ 5 $ 148
(a) Changes in OCI are reported on a pre-tax basis. The amounts in accumulated OCI are being reclassified into earnings
over the underlying debt maturity periods which end in 2025 and 2029.
On July 15, 2021, Corporate entered into an interest rate swap to hedge the fair value of $750 million of existing debt included
in "Non-current debt" on our consolidated balance sheets. The interest rate swap is designated and qualifies as a fair value
hedge. The change in the fair value of the interest rate swap and the offsetting change in the fair value of the underlying debt are
reported as components of "Interest expense."
36
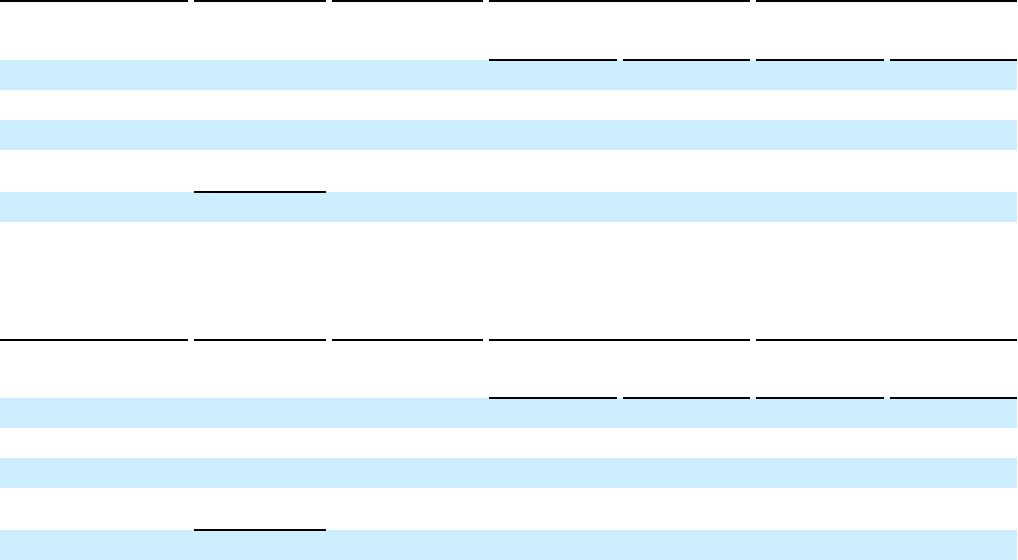
The effects on our consolidated financial statements as of and for the three and six months ended June 30, 2022 and 2021,
respectively, are as follows:
Fair value of
hedge
Location of (Gain)
Recognized in
Income Statement
(Gain) Recognized in Income
Statement Total per Income Statement
(Millions)
As of June 30,
2022
Three Months
Ended June 30,
2022
Six Months
Ended June 30,
2022
Three Months
Ended June 30,
2022
Six Months
Ended June 30,
2022
Current Liabilities $ (12) Interest Expense $ — $ (2) $ 79 $ 150
Non-current liabilities $ (70)
Cumulative effect
on hedged debt
Current debt $ 12
Non-current debt $ 70
Fair value of
hedge
Location of (Gain)
Recognized in
Income Statement
(Gain) Recognized in Income
Statement Total per Income Statement
(Millions)
As of December
31, 2021
Three Months
Ended June 30,
2021
Six Months
Ended June 30,
2021
Three Months
Ended June 30,
2021
Six Months
Ended June 30,
2021
Current Liabilities $ — Interest Expense $ — $ — $ 75 $ 148
Non-current liabilities $ (19)
Cumulative effect
on hedged debt
Current debt $ —
Non-current debt $ 19
(d) Counterparty credit risk management
NYSEG and RG&E face risks related to counterparty performance on hedging contracts due to counterparty credit default. We
have developed a matrix of unsecured credit thresholds that are applicable based on the respective counterparty’s or the
counterparty guarantor’s credit rating, as provided by Moody’s or Standard & Poor’s. When our exposure to risk for a
counterparty exceeds the unsecured credit threshold, the counterparty is required to post additional collateral or we will no
longer transact with the counterparty until the exposure drops below the unsecured credit threshold.
The wholesale power supply agreements of UI contain default provisions that include required performance assurance,
including certain collateral obligations, in the event that UI’s credit ratings on senior debt were to fall below investment grade.
If such an event had occurred as of June 30, 2022, UI would have had to post an aggregate of approximately $14 million in
collateral.
We have various master netting arrangements in the form of multiple contracts with various single counterparties that are
subject to contractual agreements that provide for the net settlement of all contracts through a single payment. Those
arrangements reduce our exposure to a counterparty in the event of a default on or termination of any single contract. For
financial statement presentation purposes, we offset fair value amounts recognized for derivative instruments and fair value
amounts recognized for the right to reclaim or the obligation to return cash collateral arising from derivative instruments
executed with the same counterparty under a master netting arrangement. As of June 30, 2022 and December 31, 2021, the
amount of cash collateral under master netting arrangements that have not been offset against net derivative positions was $92
million and $67 million, respectively. Derivative instruments settlements and collateral payments are included throughout the
“Changes in operating assets and liabilities” section of operating activities in our condensed consolidated statements of cash
flows.
Certain of our derivative instruments contain provisions that require us to maintain an investment grade credit rating on our
debt from each of the major credit rating agencies. If our debt were to fall below investment grade, we would be in violation of
those provisions and the counterparties to the derivative instruments could request immediate payment or demand immediate
and ongoing full overnight collateralization on derivative instruments in net liability positions. The aggregate fair value of all
37
derivative instruments with credit risk related contingent features that are in a liability position as of June 30, 2022 was $6
million, for which we have posted collateral.
Note 8. Contingencies and Commitments
We are party to various legal disputes arising as part of our normal business activities. We assess our exposure to these matters
and record estimated loss contingencies when a loss is probable and can be reasonably estimated. We do not provide for accrual
of legal costs expected to be incurred in connection with a loss contingency.
Transmission - ROE Complaint – CMP and UI
On September 30, 2011, the Massachusetts Attorney General, DPU, PURA, New Hampshire Public Utilities Commission,
Rhode Island Division of Public Utilities and Carriers, Vermont Department of Public Service, numerous New England
consumer advocate agencies and transmission tariff customers collectively filed a joint complaint with the FERC pursuant to
sections 206 and 306 of the Federal Power Act: against several New England Transmission Owners (NETOs) claiming that the
approved base ROE of 11.14% used by NETOs in calculating formula rates for transmission service under the ISO-New
England Open Access Transmission Tariff (OATT) was not just and reasonable and seeking a reduction of the base ROE with
refunds to customers for the 15-month refund periods beginning October 1, 2011 (Complaint I), December 27, 2012 (Complaint
II), July 31, 2014 (Complaint III) and April 29, 2016 (Complaint IV).
On October 16, 2014, the FERC issued its decision in Complaint I, setting the base ROE at 10.57% and a maximum total ROE
of 11.74% (base plus incentive ROEs) for the October 2011 – December 2012 period as well as prospectively from October 16,
2014. On March 3, 2015, the FERC upheld its decision and further clarified that the 11.74% ROE cap will be applied on a
project specific basis and not on a transmission owner’s total average transmission return. The complaints were consolidated
and the administrative law judge issued an initial decision on March 22, 2016. The initial decision determined that, (1) for the
fifteen month refund period in Complaint II, the base ROE should be 9.59% and that the ROE Cap (base ROE plus incentive
ROEs) should be 10.42% and (2) for the fifteen month refund period in Complaint III and prospectively, the base ROE should
be 10.90% and that the ROE Cap should be 12.19%. The initial decision in Complaints II and III is the administrative law
judge’s recommendation to the FERC Commissioners.
CMP and UI reserved for refunds for Complaints I, II and III consistent with the FERC’s March 3, 2015 decision in Complaint
I. Refunds were provided to customers for Complaint I. The CMP and UI total reserve associated with Complaints II and III is
$27 million and $8 million, respectively, as of June 30, 2022, which has not changed since December 31, 2021, except for the
accrual of carrying costs. If adopted as final by the FERC, the impact of the initial decision by the FERC administrative law
judge would be an additional aggregate reserve for Complaints II and III of $17 million, which is based upon currently
available information for these proceedings.
Following various intermediate hearings, orders and appellate decisions, on October 16, 2018, the FERC issued an order
directing briefs and proposing a new methodology to calculate the NETOs ROE that is contained in NETOs’ transmission
formula rate on file at the FERC (the October 2018 Order). Pursuant to the October 2018 Order, the NETOs filed initial briefs
on the proposed methodology in all four Complaints on January 11, 2019 and replied to the initial briefs on March 8, 2019.
On November 21, 2019, the FERC issued rulings on two complaints challenging the base return on equity for Midcontinent
Independent System Operator, or MISO transmission owners. These rulings established a new zone of reasonableness based on
equal weighting of the DCF and capital-asset pricing model for establishing the base return on equity. This resulted in a base
return on equity of 9.88% as the midpoint of the zone of reasonableness. Various parties have requested rehearing on this
decision, which was granted. On May 21, 2020, FERC issued a ruling, which, among other things, adjusted the methodology to
determine the MISO transmission owners’ ROE, resulting in an increase in ROE from 9.88% to 10.02% by utilizing the risk
premium model in addition to the DCF model and capital-asset pricing model under both prongs of Section 206 of the FPA, and
calculated the zone of reasonableness into equal thirds rather than employing the quartile approach. On November 19, 2020,
FERC issued an order addressing arguments raised on rehearing of its May 21, 2020 order making minor adjustments to certain
typographical errors with regard to some of the case inputs it included in its Risk Premium model analysis. However, those
minor adjustments did not affect the outcome of the case, leaving the 10.02% ROE established by the May 21, 2020 order in
place. Parties to these orders affecting the MISO transmission owners’ base ROE petitioned for their review at the D.C. Circuit
Court of Appeals in January 2021. The NETO’s submitted an amici curia brief in support of the MISO transmission owners’ on
March 17, 2021. We cannot predict the outcome of these proceedings, including the potential impact the MISO transmission
owners' ROE proceeding may have in establishing a precedent for our pending four Complaints.
On April 15, 2021, the FERC issued a supplemental Notice of Proposed Rulemaking (Supplemental NOPR) that proposes to
eliminate the 50 basis-point ROE incentive for utilities who join Regional Transmission Organizations after three years of
membership. The NETOs submitted initial comments in opposition to the Supplemental NOPR on June 25, 2021 and reply
38
comments on July 26, 2021. If the elimination of the 50 basis-point ROE incentive adder becomes final, we estimate we would
have an approximately $3 million reduction in earnings per year. We cannot predict the outcome of this proceeding.
California Energy Crisis Litigation
Two California agencies brought a complaint in 2001 against a long-term power purchase agreement entered into by
Renewables, as seller, to the California Department of Water Resources, as purchaser, alleging that the terms and conditions of
the power purchase agreement were unjust and unreasonable. The FERC dismissed Renewables from the proceedings;
however, the Ninth Circuit Court of Appeals reversed the FERC's dismissal of Renewables from the proceeding.
Joining with two other parties, Renewables filed a petition for certiorari in the United States Supreme Court on May 3, 2007. In
an order entered on June 27, 2008, the Supreme Court granted Renewables’ petition for certiorari, vacated the appellate court's
judgment, and remanded the case to the appellate court for further consideration in light of the Supreme Court’s decision in a
similar case. In light of the Supreme Court's order, on December 4, 2008, the Ninth Circuit Court of Appeals vacated its prior
opinion and remanded the complaint proceedings to the FERC for further proceedings consistent with the Supreme Court's
rulings. In 2014, the FERC assigned an administrative law judge to conduct evidentiary hearings. Following discovery, the
FERC trial staff recommended that the complaint against Renewables be dismissed.
A hearing was held before a FERC administrative law judge in November and early December 2015. A preliminary proposed
ruling by the administrative law judge was issued on April 12, 2016. The proposed ruling found no evidence that Renewables
had engaged in any unlawful market conduct that would justify finding the Renewables power purchase agreements unjust and
unreasonable. However, the proposed ruling did conclude that the price of the power purchase agreements imposed an
excessive burden on customers in the amount of $259 million. Renewables position, as presented at hearings and agreed by the
FERC trial staff, is that Renewables entered into bilateral power purchase contracts appropriately and complied with all
applicable legal standards and requirements. The parties have submitted briefs on exceptions to the administrative law judge’s
proposed ruling to the FERC. In April 2018, Renewables requested, based on the nearly two years of delay from the
preliminary proposed ruling and the Supreme Court precedent, that the FERC issue a final decision expeditiously. On June 17,
2021, the FERC issued an Order Establishing Limited Remand remanding the case to the administrative law judge for
additional detailed findings and legal analysis with respect to the impact of the conduct of one of the parties other than
Renewables on their long-term contracts. The order did not address any of the other findings, including all of the findings with
respect to Renewables, which remain pending. On July 9, 2021, Renewables filed a motion requesting that the FERC
expeditiously issue a final decision with respect to the Renewables long-term contract rather than waiting for the administrative
law judge’s ruling. On June 23, 2022, the administrative law judge issued additional findings and analysis to FERC with respect
to the other party in the matter. These did not address any of the Renewables’ claims. The entire case has now been fully
remanded to FERC. We cannot predict the outcome of this proceeding.
Guarantee Commitments to Third Parties
As of June 30, 2022, we had approximately $625 million of standby letters of credit, surety bonds, guarantees and
indemnifications outstanding. We also provided a guaranty related to Renewables' commitment to contribute equity to Vineyard
Wind as described in Note 19, which is in addition to the amounts above. These instruments provide financial assurance to the
business and trading partners of AVANGRID, its subsidiaries and equity method investees in their normal course of business.
The instruments only represent liabilities if AVANGRID or its subsidiaries fail to deliver on contractual obligations. We
therefore believe it is unlikely that any material liabilities associated with these instruments will be incurred and, accordingly,
as of June 30, 2022, neither we nor our subsidiaries have any liabilities recorded for these instruments.
NECEC Commitments
On January 4, 2021, CMP transferred the New England Clean Energy Connect, or NECEC, project to NECEC Transmission
LLC, a wholly-owned subsidiary of Networks. Among other things, NECEC Transmission LLC and/or CMP committed to
approximately $90 million of future payments to support various programs in the state of Maine, of which approximately
$9 million was paid through the end of 2021. In December 2021 the remaining future payments were suspended following the
halt in construction of the NECEC project.
Note 9. Environmental Liabilities
Environmental laws, regulations and compliance programs may occasionally require changes in our operations and facilities
and may increase the cost of electric and natural gas service. We do not provide for accruals of legal costs expected to be
incurred in connection with loss contingencies.
39
Waste sites
The Environmental Protection Agency and various state environmental agencies, as appropriate, have notified us that we are
among the potentially responsible parties that may be liable for costs incurred to remediate certain hazardous substances at
twenty-six waste sites, which do not include sites where gas was manufactured in the past. Sixteen of the twenty-six sites are
included in the New York State Registry of Inactive Hazardous Waste Disposal Sites; five sites are included in Maine’s
Uncontrolled Sites Program; one site is included in the Brownfield Cleanup Program and one site is included on the
Massachusetts Non-Priority Confirmed Disposal Site list. The remaining sites are not included in any registry list. Finally, six
of the twenty-six sites are also included on the National Priorities list. Any liability may be joint and several for certain sites.
We have recorded an estimated liability of $7 million related to ten of the twenty-six sites. We have paid remediation costs
related to the remaining sixteen sites and do not expect to incur additional liabilities. Additionally, we have recorded an
estimated liability of $10 million related to another twelve sites where we believe it is probable that we will incur remediation
and/or monitoring costs, although we have not been notified that we are among the potentially responsible parties or that we are
regulated under State Resource Conservation and Recovery Act programs. It is possible the ultimate cost to remediate these
sites may be significantly more than the accrued amount. As of June 30, 2022, our estimate for costs to remediate these sites
ranges from $15 million to $23 million. Factors affecting the estimated remediation amount include the remedial action plan
selected, the extent of site contamination, and the allocation of the clean-up costs.
Manufactured Gas Plants
We have a program to investigate and perform necessary remediation at our fifty-three sites where gas was manufactured in the
past (Manufactured Gas Plants, or MGPs). Six sites are included in the New York State Registry; three sites are included in the
New York State Department of Environmental Conservation Multi-Site Order on Consent; and three sites are part of Maine’s
Voluntary Response Action Program with two such sites part of Maine’s Uncontrolled Sites Program. The remaining sites are
not included in any registry list. We have entered into consent orders with various environmental agencies to investigate and,
where necessary, remediate forty-one of the fifty-three sites.
As of June 30, 2022, our estimate for all costs related to investigation and remediation of the fifty-three sites ranges from $165
million to $268 million. Our estimate could change materially based on facts and circumstances derived from site
investigations, changes in required remedial actions, changes in technology relating to remedial alternatives and changes to
current laws and regulations.
Certain of our Connecticut and Massachusetts regulated gas companies own or have previously owned properties where MGPs
had historically operated. MGP operations have led to contamination of soil and groundwater with petroleum hydrocarbons,
benzene and metals, among other things, at these properties, the regulation and cleanup of which is regulated by the federal
Resource Conservation and Recovery Act as well as other federal and state statutes and regulations. Each of the companies has
or had an ownership interest in one or more such properties contaminated as a result of MGP-related activities. Under the
existing regulations, the cleanup of such sites requires state and at times, federal, regulators’ involvement and approval before
cleanup can commence. In certain cases, such contamination has been evaluated, characterized and remediated. In other cases,
the sites have been evaluated and characterized, but not yet remediated. Finally, at some of these sites, the scope of the
contamination has not yet been fully characterized; as of June 30, 2022, no liability was recorded related to these sites and no
amount of loss, if any, can be reasonably estimated at this time. In the past, the companies have received approval for the
recovery of MGP-related remediation expenses from customers through rates and will seek recovery in rates for ongoing MGP-
related remediation expenses for all of their MGP sites.
As of both June 30, 2022 and December 31, 2021, the liability associated with our MGP sites in Connecticut was $113 million,
the remediation costs of which could be significant and will be subject to a review by PURA as to whether these costs are
recoverable in rates.
As of June 30, 2022 and December 31, 2021, our total recorded liability to investigate and perform remediation at all known
inactive MGP sites discussed above and other sites was $298 million and $303 million, respectively. We recorded a
corresponding regulatory asset, net of insurance recoveries and the amount collected from FirstEnergy, as described below,
because we expect to recover the net costs in rates. Our environmental liability accruals are recorded on an undiscounted basis
and are expected to be paid through the year 2102.
FirstEnergy
NYSEG and RG&E each sued FirstEnergy under the Comprehensive Environmental Response, Compensation, and Liability
Act to recover environmental cleanup costs at certain former MGP sites, which are included in the discussion above. In 2011,
the District Court issued a decision and order in NYSEG’s favor, which was upheld on appeal, requiring FirstEnergy to pay
NYSEG for past and future clean-up costs at the sixteen sites in dispute. In 2008, the District Court issued a decision and order
40
in RG&E's favor requiring FirstEnergy to pay RG&E for past and future clean-up costs at the two MGP sites in dispute.
FirstEnergy remains liable for a substantial share of clean up expenses at the MGP sites. Based on projections as of June 30,
2022, FirstEnergy’s share of clean-up costs owed to NYSEG & RG&E is estimated at approximately $13 million and
$7 million, respectively. These amounts are being treated as contingent assets and have not been recorded as either a receivable
or a decrease to the environmental provision. Any recovery will be flowed through to NYSEG and RG&E customers, as
applicable.
English Station
In January 2012, Evergreen Power, LLC (Evergreen Power) and Asnat Realty LLC (Asnat), then owners of a former generation
site on the Mill River in New Haven (English Station) that UI sold to Quinnipiac Energy in 2000, filed a lawsuit in federal
district court in Connecticut related to environmental remediation at the English Station site. This proceeding was stayed in
2014 pending resolutions of other proceedings before the Connecticut Department of Energy and Environmental Protection
(DEEP) concerning the English Station site. In December 2016, the court administratively closed the file without prejudice to
reopen upon the filing of a motion to reopen by any party. This claim was dismissed with prejudice in April 2022 in connection
with the settlement agreement between the parties on the below-referenced state claim.
In December 2013, Evergreen Power and Asnat filed a subsequent lawsuit related to the English Station site. On April 16, 2018,
the plaintiffs filed a revised complaint alleging fraud and unjust enrichment against UIL and UI and adding former UIL officers
as named defendants alleging fraud. On February 21, 2019, the court granted our Motion to Strike with respect to all counts
except for the count against UI for unjust enrichment. The counts stricken include all counts against the individual defendants
as well as against UIL. The plaintiffs appealed the court's decision to strike, which decision the Appeals Court affirmed on May
4, 2021. The plaintiffs filed a petition to appeal to the Connecticut Supreme Court, which was denied, leaving only the claim
against UI for unjust enrichment. In April 2022, UI entered into a settlement agreement with Evergreen Power and Asnat
settling the remaining claim and the lawsuit was withdrawn.
On April 8, 2013, DEEP issued an administrative order addressed to UI, Evergreen Power, Asnat and others, ordering the
parties to take certain actions related to investigating and remediating the English Station site. This proceeding was stayed while
DEEP and UI continue to work through the remediation process pursuant to the consent order described below. Status reports
are periodically filed with DEEP.
On August 4, 2016, DEEP issued a partial consent order (the consent order), that, subject to its terms and conditions, requires
UI to investigate and remediate certain environmental conditions within the perimeter of the English Station site. Under the
consent order, to the extent that the cost of this investigation and remediation is less than $30 million, UI will remit to the State
of Connecticut the difference between such cost and $30 million to be used for a public purpose as determined in the discretion
of the Governor of the State of Connecticut, the Attorney General of the State of Connecticut and the Commissioner of DEEP.
UI is obligated to comply with the terms of the consent order even if the cost of such compliance exceeds $30 million. Under
the terms of the consent order, the state will discuss options with UI on recovering or funding any cost above $30 million such
as through public funding or recovery from third parties; however, it is not bound to agree to or support any means of recovery
or funding. UI has continued its process to investigate and remediate the environmental conditions within the perimeter of the
English Station site pursuant to the consent order.
As of June 30, 2022 and December 31, 2021, the amount reserved related to English Station was $21 million and $22 million,
respectively. Since inception, we have recorded $35 million to the reserve which has been offset with cash payments over time.
We cannot predict the outcome of this matter.
Note 10. Post-retirement and Similar Obligations
We made no pension contributions for the three and six months ended June 30, 2022. We expect to make additional
contributions of $23 million for the remainder of 2022.
41
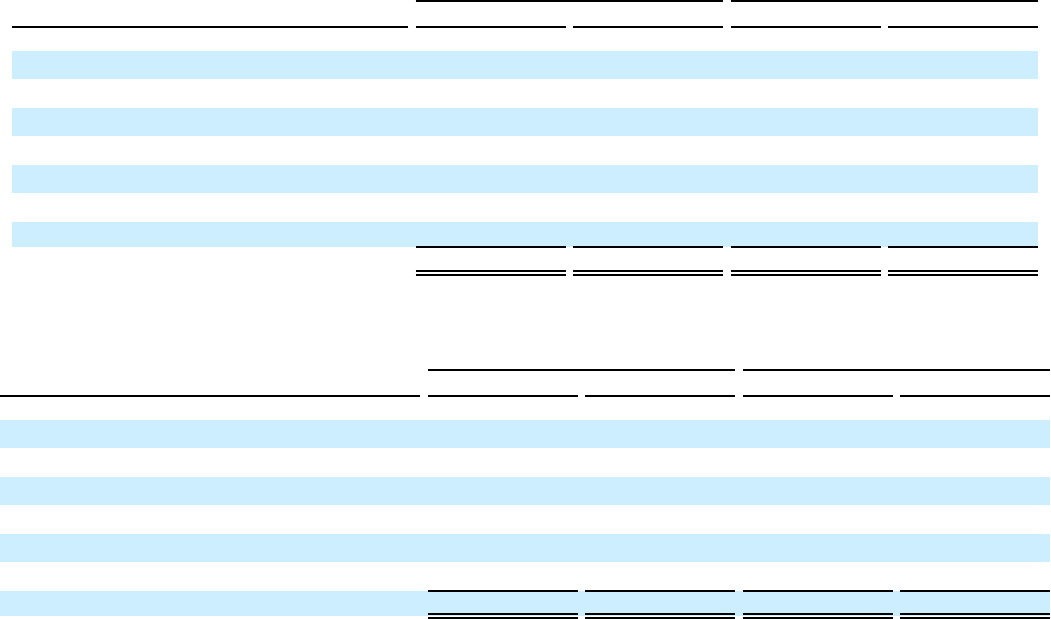
The components of net periodic benefit cost for pension benefits for the three and six months ended June 30, 2022 and 2021,
respectively, consisted of:
Three Months Ended June 30, Six Months Ended June 30,
2022 2021 2022 2021
(Millions)
Service cost
$ 7 $ 10 $ 15 $ 20
Interest cost
(7) 22 17 44
Expected return on plan assets
(6) (51) (51) (101)
Amortization of:
Prior service costs
— 1 1 1
Actuarial loss
11 24 29 59
Curtailment Charge
(25) — (23) —
Net Periodic Benefit Cost
$ (20) $ 6 $ (12) $ 23
The components of net periodic benefit cost for postretirement benefits for the three and six months ended June 30, 2022 and
2021, respectively, consisted of:
Three Months Ended June 30, Six Months Ended June 30,
2022 2021 2022 2021
(Millions)
Service cost
$ — $ — $ 1 $ 1
Interest cost
2 3 5 5
Expected return on plan assets
(1) (1) (3) (3)
Amortization of:
Prior service costs
— (1) — (3)
Actuarial loss
(1) — (2) 1
Net Periodic Benefit Cost
$ — $ 1 $ 1 $ 1
In March 2022 the AVANGRID board approved plan amendments to freeze pension benefit accruals and contribution credits
for Networks non-union employees effective June 30, 2022. The balance sheet impact from these amendments was a reduction
in pension liabilities and regulatory assets of approximately $200 million at June 30, 2022. The plan changes resulted in a
curtailment charge credit of $23 million. Our expected rate of return on assets (EROA) was updated for certain plans based on
our de-risking glide-path model. This approach reduces investment risk as the plan’s funded status improves, resulting in our
weighted average EROA for 2022 declining from 6.3% used in the first quarter calculation of pension costs to 5.9%, which will
be used for the remainder of the year.
Note 11. Equity
As of both June 30, 2022 and December 31, 2021, we had 112,543 shares of common stock held in trust and no convertible
preferred shares outstanding. During both the three and six months ended June 30, 2022, we released 0 shares of common stock
held in trust. During the three and six months ended June 30, 2021, we released 4,260 and 292,594 shares of common stock
held in trust, respectively.
We maintain a repurchase agreement with J.P. Morgan Securities, LLC. (JPM), pursuant to which JPM will, from time to time,
acquire, on behalf of AVANGRID, shares of common stock of AVANGRID. The purpose of the stock repurchase program is to
allow AVANGRID to maintain Iberdrola's relative ownership percentage of approximately 81.5%. The stock repurchase
program may be suspended or discontinued at any time upon notice. As of June 30, 2022, a total of 997,983 shares have been
repurchased in the open market, all of which are included as AVANGRID treasury shares. The total cost of all repurchases,
including commissions, was $47 million as of June 30, 2022.
42
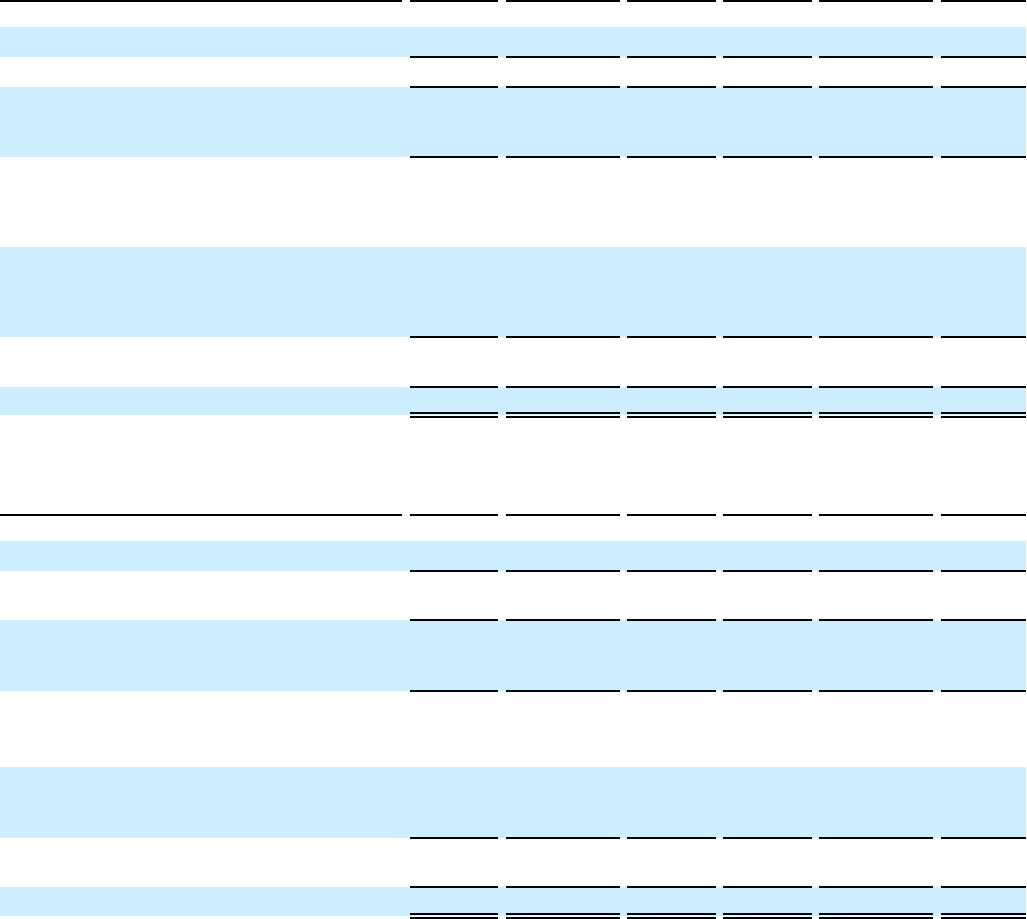
Accumulated Other Comprehensive Loss
Accumulated Other Comprehensive Loss for the three and six months ended June 30, 2022 and 2021, respectively, consisted of:
As of
March 31,
Three Months
Ended
June 30,
As of
June 30,
As of
March 31,
Three Months
Ended
June 30,
As of
June 30,
2022 2022 2022 2021 2021 2021
(Millions)
Change in revaluation of defined benefit plans $ (10) $ — $ (10) $ (12) $ — $ (12)
(Loss) gain on nonqualified pension plans (19) — (19) (20) — (20)
Unrealized (loss) gain from equity method
investment, net of income tax benefit of $(1)
for 2022 and $(4) for 2021 (a) 6 (4) 2 — (3) (3)
Unrealized (loss) gain during period on
derivatives qualifying as cash flow hedges, net
of income tax expense (benefit) of $15 for
2022 and $(21) for 2021 (233) 39 (194) (62) (73) (135)
Reclassification to net income of losses on cash
flow hedges, net of income tax expense
(benefit) expense of $2 for 2022 and $(3) for
2021 (b) (21) 6 (15) (43) 4 (39)
(Loss) Gain on derivatives qualifying as cash
flow hedges (254) 45 (209) (105) (69) (174)
Accumulated Other Comprehensive Loss
$ (277) $ 41 $ (236) $ (137) $ (72) $ (209)
As of
December
31,
Six Months
Ended
June 30,
As of
June 30,
As of
December
31,
Six Months
Ended
June 30,
As of
June 30,
2021 2022 2022 2020 2021 2021
(Millions)
Change in revaluation of defined benefit plans $ (10) $ — $ (10) $ (12) $ — $ (12)
(Loss) gain on nonqualified pension plans, net
of income tax expense of $3 for 2022 (28) 9 (19) (20) — (20)
Unrealized (loss) gain from equity method
investment, net of income tax expense
(benefit) of $4 for 2022 and $(4) for 2021 (a) $ (9) $ 11 $ 2 $ — $ (3) $ (3)
Unrealized loss during period on derivatives
qualifying as cash flow hedges, net of income
tax benefit of $0 for 2022 and $(26) for 2021 (194) — (194) (35) (100) (135)
Reclassification to net income of losses on cash
flow hedges, net of income tax expense
(benefit) of $6 for 2022 and $(4) for 2021 (b) (32) 17 (15) (44) 5 (39)
(Loss) Gain on derivatives qualifying as cash
flow hedges (226) 17 (209) (79) (95) (174)
Accumulated Other Comprehensive Loss
$ (273) $ 37 $ (236) $ (111) $ (98) $ (209)
(a) Foreign currency and interest rate contracts.
(b) Reclassification is reflected in the operating expenses and interest expense, net of capitalization and line items in our
condensed consolidated statements of income.
Note 12. Earnings Per Share
Basic earnings per share is computed by dividing net income attributable to AVANGRID by the weighted-average number of
shares of our common stock outstanding. During the three and six months ended June 30, 2022 and 2021, while we did have
securities that were dilutive, these securities did not result in a change in our earnings per share calculations for the three
months ended June 30, 2022, and the three and six months ended June 30, 2021. The dilutive securities, which consist of
performance and restricted units, did result in a change in our earnings per share calculation for the six months ended June 30,
2022.
43
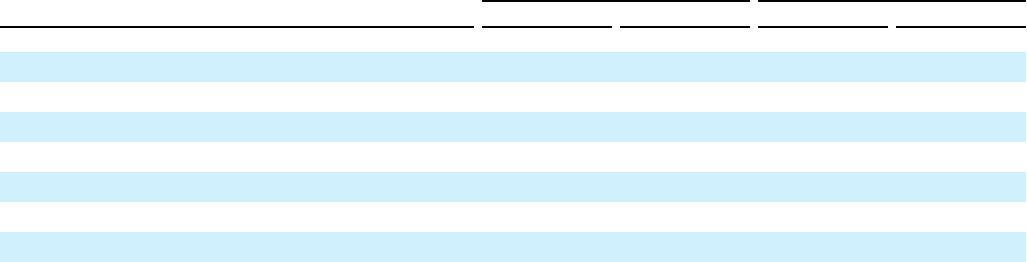
The calculations of basic and diluted earnings per share attributable to AVANGRID, for the three and six months ended
June 30, 2022 and 2021, respectively, consisted of:
Three Months Ended June 30, Six Months Ended June 30,
2022 2021 2022 2021
(Millions, except for number of shares and per share data)
Numerator:
Net income attributable to AVANGRID
$ 184 $ 98 $ 629 $ 432
Denominator:
Weighted average number of shares outstanding - basic
386,736,774 347,121,197 386,717,560 328,412,163
Weighted average number of shares outstanding - diluted
387,219,348 347,419,064 387,166,378 328,795,944
Earnings per share attributable to AVANGRID
Earnings Per Common Share, Basic
$ 0.48 $ 0.28 $ 1.63 $ 1.31
Earnings Per Common Share, Diluted
$ 0.48 $ 0.28 $ 1.62 $ 1.31
Note 13. Segment Information
Our segment reporting structure uses our management reporting structure as its foundation to reflect how AVANGRID
manages the business internally and is organized by type of business. We report our financial performance based on the
following two reportable segments:
• Networks: includes all of the energy transmission and distribution activities, any other regulated activity originating in
New York and Maine and regulated electric distribution, electric transmission and gas distribution activities originating
in Connecticut and Massachusetts. The Networks reportable segment includes nine rate regulated operating segments.
These operating segments generally offer the same services distributed in similar fashions, have the same types of
customers, have similar long-term economic characteristics and are subject to similar regulatory requirements, allowing
these operations to be aggregated into one reportable segment.
• Renewables: activities relating to renewable energy, mainly wind energy generation and trading related with such
activities.
The chief operating decision maker evaluates segment performance based on segment adjusted net income defined as net
income adjusted to exclude mark-to-market earnings from changes in the fair value of derivative instruments, costs incurred in
connection with the COVID-19 pandemic and costs incurred related to the PNMR Merger.
Products and services are sold between reportable segments and affiliate companies at cost. Segment income, expense and
assets presented in the accompanying tables include all intercompany transactions that are eliminated in our condensed
consolidated financial statements. Refer to Note 4 - Revenue for more detailed information on revenue by segment.
44
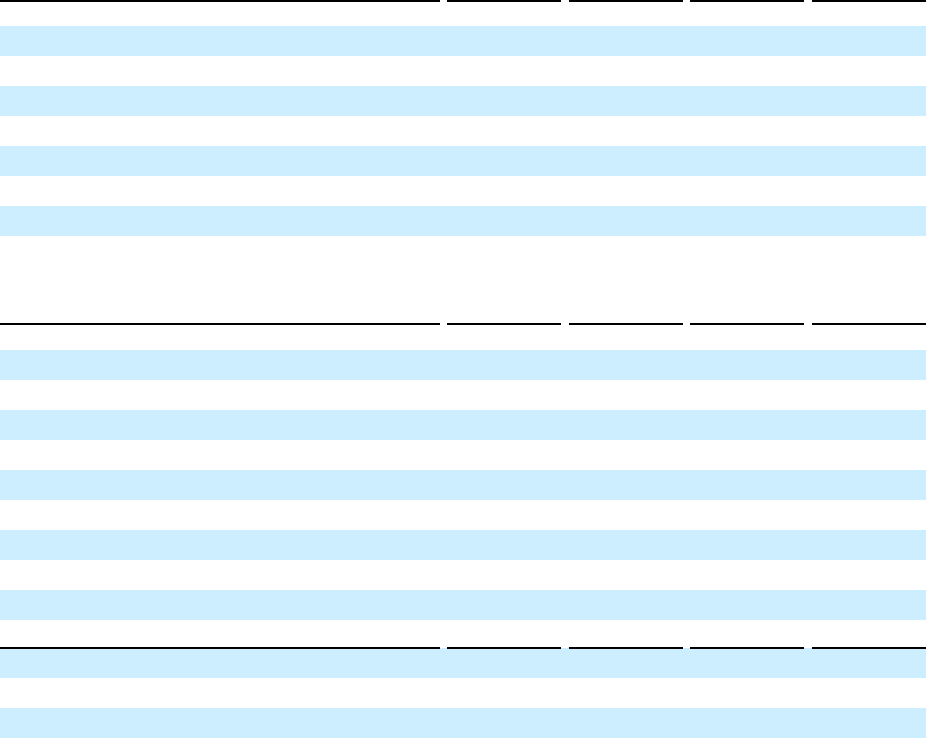
Segment information as of and for the three and six months ended June 30, 2022, consisted of:
Three Months Ended June 30, 2022 Networks Renewables Other (a)
AVANGRID
Consolidated
(Millions)
Revenue - external
$ 1,463 $ 330 $ 1 $ 1,794
Revenue - intersegment
1 — (1) —
Depreciation and amortization
164 106 1 271
Operating income (loss)
200 28 (7) 221
Earnings from equity method investments
2 4 — 6
Interest expense, net of capitalization
61 3 15 79
Income tax expense (benefit)
21 (20) (5) (4)
Adjusted net income
$ 129 $ 66 $ (17) $ 178
Six Months Ended June 30, 2022 Networks Renewables Other (a)
AVANGRID
Consolidated
(Millions)
Revenue - external
$ 3,398 $ 528 $ 1 $ 3,927
Revenue - intersegment
1 — (1) —
Depreciation and amortization
325 206 1 532
Operating income
519 10 (6) 523
Earnings from equity method investments
5 254 — 259
Interest expense, net of capitalization
111 6 33 150
Income tax expense (benefit)
52 21 (9) 64
Adjusted net income
382 277 (32) 628
Capital expenditures
815 586 2 1,403
As of June 30, 2022
Property, plant and equipment
19,145 10,907 11 30,063
Equity method investments
155 276 — 431
Total assets
$ 26,485 $ 13,271 $ (4) $ 39,752
(a) Includes Corporate and intersegment eliminations.
45

Segment information for the three and six months ended June 30, 2021 and as of December 31, 2021, consisted of:
Three Months Ended June 30, 2021 Networks Renewables Other (a)
AVANGRID
Consolidated
(Millions)
Revenue - external
$ 1,218 $ 258 $ 1 $ 1,477
Revenue - intersegment
1 — (1) —
Depreciation and amortization
149 100 1 250
Operating income (loss)
147 (16) — 131
Earnings (losses) from equity method investments
5 (1) — 4
Interest expense, net of capitalization
53 — 22 75
Income tax expense (benefit)
24 (21) 7 10
Adjusted net income
$ 108 $ 41 $ (26) $ 122
Six Months Ended June 30, 2021 Networks Renewables Other (a)
AVANGRID
Consolidated
(Millions)
Revenue - external
$ 2,791 $ 651 $ 1 $ 3,443
Revenue - intersegment
1 — (1) —
Depreciation and amortization
305 191 1 497
Operating income
460 76 1 537
Earnings (losses) from equity method investments
7 (2) — 5
Interest expense, net of capitalization
106 — 42 148
Income tax expense (benefit)
66 (30) (12) 24
Adjusted net income
337 164 (25) 476
Capital expenditures
971 293 — 1,264
As of December 31, 2021
Property, plant and equipment
18,737 10,118 11 28,866
Equity method investments
148 412 — 560
Total assets
$ 26,126 $ 12,578 $ 800 $ 39,504
(a) Includes Corporate and intersegment eliminations.
Reconciliation of Adjusted Net Income to Net Income attributable to AVANGRID for the three and six months ended June 30,
2022 and 2021, respectively, is as follows:
Three Months Ended June 30, Six Months Ended June 30,
2022 2021 2022 2021
(Millions)
Adjusted Net Income Attributable to Avangrid, Inc.
$ 178 $ 122 $ 628 $ 476
Adjustments:
Mark-to-market earnings - Renewables (1)
8 (21) 5 (41)
Impact of COVID-19 (2)
1 (9) (1) (15)
Merger costs (3)
(2) (3) (2) (4)
Income tax impact of adjustments
(2) 9 (1) 16
Net Income Attributable to Avangrid, Inc.
$ 184 $ 98 $ 629 $ 432
(1) Mark-to-market earnings relates to earnings impacts from changes in the fair value of Renewables' derivative
instruments associated with electricity and natural gas.
(2) Represents costs incurred in connection with the COVID-19 pandemic, mainly related to bad debt provisions.
(3) Pre-merger costs incurred.
46
Note 14. Related Party Transactions
We engage in related party transactions that are generally billed at cost and in accordance with applicable state and federal
commission regulations.
Related party transactions for the three and six months ended June 30, 2022 and 2021, respectively, consisted of:
Three Months Ended June 30, 2022 2021
(Millions) Sales To Purchases From Sales To Purchases From
Iberdrola, S.A.
$ — $ (10) $ — $ (14)
Iberdrola Renovables Energía, S.L.
$ — $ (3) $ — $ (3)
Iberdrola Financiación, S.A.
$ — $ (2) $ — $ (1)
Vineyard Wind
$ 1 $ — $ 4 $ —
Iberdrola Solutions
$ — $ — $ 1 $ (1)
Other
$ — $ — $ — $ —
Six Months Ended June 30, 2022 2021
(Millions) Sales To Purchases From Sales To Purchases From
Iberdrola, S.A.
$ — $ (22) $ — $ (27)
Iberdrola Renovables Energía, S.L.
$ — $ (5) $ — $ (5)
Iberdrola Financiación, S.A.
$ — $ (5) $ — $ (3)
Vineyard Wind
$ 3 $ — $ 8 $ —
Iberdrola Solutions
$ — $ — $ 8 $ (39)
Other
$ — $ (1) $ 1 $ (1)
Related party balances as of June 30, 2022 and December 31, 2021, respectively, consisted of:
As of June 30, 2022 December 31, 2021
(Millions) Owed By Owed To Owed By Owed To
Iberdrola
$ — $ (19) $ 3 $ (43)
Iberdrola Financiación, S.A.
$ — $ (4) $ — $ (9)
Vineyard Wind
$ 2 $ (8) $ 8 $ (8)
Iberdrola Solutions
$ — $ (1) $ — $ (2)
Other
$ — $ (6) $ — $ (1)
Transactions with Iberdrola relate predominantly to the provision and allocation of corporate services and management fees. All
costs that can be specifically allocated, to the extent possible, are charged directly to the company receiving such services. In
situations when Iberdrola corporate services are provided to two or more companies of AVANGRID, any costs remaining after
direct charges are allocated using agreed upon cost allocation methods designed to allocate such costs. We believe that the
allocation method used is reasonable.
We have a bi-lateral demand note agreement with Iberdrola Solutions, LLC, which had notes payable balance of $1 million and
$2 million, respectively, as of June 30, 2022 and December 31, 2021. Renewables also has financial forward power contracts
with Iberdrola Solutions to hedge Renewables' merchant wind exposure in Texas.
There have been no guarantees provided or received for any related party receivables or payables. These balances are unsecured
and are typically settled in cash. Interest is not charged on regular business transactions but is charged on outstanding loan
balances. There have been no impairments or provisions made against any affiliated balances.
AVANGRID optimizes its liquidity position as part of the Iberdrola Group and is a party to a liquidity agreement with a
financial institution, along with certain members of the Iberdrola Group. Cash surpluses remaining after meeting the liquidity
requirements of AVANGRID and its subsidiaries may be deposited at the financial institution. Deposits, or credit balances,
serve as collateral against the debit balances of other parties to the liquidity agreement. The balance at both June 30, 2022 and
December 31, 2021, was $0.
AVANGRID has a credit facility with Iberdrola Financiacion, S.A.U., a company of the Iberdrola Group. The facility has a
limit of $500 million and matures on June 18, 2023. AVANGRID pays a facility fee of 10.5 basis points annually on the
facility. As of June 30, 2022 and December 31, 2021, there was no outstanding amount under this credit facility.
47

See Note 19 - Equity Method Investments for more information on Vineyard Wind, LLC (Vineyard Wind).
Note 15. Other Financial Statement Items
Accounts receivable and unbilled revenue, net
Accounts receivable and unbilled revenues, net as of June 30, 2022 and December 31, 2021 consisted of:
As of June 30, 2022 December 31, 2021
(Millions)
Trade receivables and unbilled revenues $ 1,461 $ 1,420
Allowance for credit losses (142) (151)
Accounts receivable and unbilled revenues, net $ 1,319 $ 1,269
The change in the allowance for credit losses for the three and six months ended June 30, 2022 and 2021 consisted of:
Three Months Ended June 30, Six Months Ended June 30,
(Millions) 2022 2021 2022 2021
As of Beginning of Period, $ 153 $ 135 $ 151 $ 108
Current period provision 3 26 23 65
Write-off as uncollectible (14) (11) (32) (23)
As of June 30, $ 142 $ 150 $ 142 $ 150
The Deferred Payment Arrangements (DPA) receivable balance was $131 million and $108 million at June 30, 2022 and
December 31, 2021, respectively. The allowance for credit losses for DPAs at June 30, 2022 and December 31, 2021 was $82
million and $68 million respectively. Furthermore, the change in the allowance for credit losses associated with the DPAs for
the three and six months ended June 30, 2022 was $12 million and $15 million, respectively, and for the three and six months
ended June 30, 2021, was $9 million and $14 million, respectively.
Prepayments and other current assets
Included in prepayments and other current assets are $50 million and $95 million of prepaid other taxes as of June 30, 2022 and
December 31, 2021, respectively.
Property, plant and equipment and intangible assets
The accumulated depreciation and amortization as of June 30, 2022 and December 31, 2021, respectively, were as follows:
June 30, December 31,
As of 2022 2021
(Millions)
Property, plant and equipment
Accumulated depreciation
$ 11,071 $ 10,589
Intangible assets
Accumulated amortization
$ 325 $ 317
As of June 30, 2022 and 2021, accrued liabilities for property, plant and equipment additions were $175 million and
$296 million, respectively.
In November 2021, Maine voters approved, by virtue of a referendum, L.D. 1295 (I.B. 1) (130th Legis. 2021), , “An Act To
Require Legislative Approval of Certain Transmission Lines, Require Legislative Approval of Certain Transmission Lines and
Facilities and Other Projects on Public Reserved Lands and Prohibit the Construction of Certain Transmission Lines in the
Upper Kennebec Region”(the “Initiative”), which prohibits the construction of the NECEC project. Subsequently, Networks
and NECEC Transmission LLC filed a lawsuit challenging the constitutionality of the Initiative and requested injunctive relief
preventing retroactive enforcement of the Initiative to the NECEC project, including a preliminary injunction preventing
retroactive enforcement during the pendency of the lawsuit. At December 31, 2021, an indicator of impairment was identified
and we performed a test of recoverability using estimated undiscounted expected project cash flows and compared to our
estimated project costs and determined no impairment loss was required. In May 2022, oral arguments related to the
preliminary injunction were heard before the Law Court and the decision is pending. These events occurring in 2022 did not
require an updated review of recoverability at June 30, 2022, due to the lack of substantive developments with the outstanding
lawsuits and the NECEC project status, and no impairment loss was recorded. The outcome of these ongoing legal proceedings
could have an adverse effect on the success of the NECEC project indicating that the carrying amount may not be recoverable.
48
We cannot predict the outcome of these proceedings and the results of such evaluation, if any. As of June 30, 2022 and
December 31, 2021, we have capitalized approximately $575 million and $546 million, respectively, for the NECEC project.
Debt
Long-term debt issuance
On January 31, 2022, UI issued $150 million aggregate principal amount of unsecured notes maturing in 2032 at a fixed interest
rate of 2.25%.
On April 6, 2022, NYSEG issued $67 million aggregate principal amount of Pollution Control Bonds maturing in 2028. The
bonds bear a 4.00% fixed coupon and were priced at 104.15% to yield 3.3%.
Supplier Financing Arrangements
We operate a supplier financing arrangement. We arranged for the extension of payment terms with some suppliers, which
could elect to be paid by a financial institution earlier than maturity under supplier financing arrangements. Due to the interest
cost associated with these arrangements, the balances are classified as "Notes payable" on our consolidated balance sheets. The
balance relates to capital expenditures and, therefore, is treated as non-cash activity, and is reported under financing activity of
the consolidated statement of cash flows when the balance is paid. As of June 30, 2022 and December 31, 2021, the amount of
notes payable under supplier financing arrangements was $94 million and $161 million, respectively. As of June 30, 2022 and
December 31, 2021, the weighted average interest rate on the balance was 3.46% and 0.82%, respectively.
Other current liabilities
Included in other current liabilities are $212 million and $204 million of advances received as of June 30, 2022 and
December 31, 2021, respectively.
Note 16. Income Tax Expense
The effective tax rates, inclusive of federal and state income tax, for the three and six months ended June 30, 2022, were (2.5)%
and 9.8%, respectively. The effective tax rates for the three and six months ended June 30, 2022, are below the federal statutory
tax rate of 21%, primarily due to the recognition of production tax credits associated with wind production, the effect of the
excess deferred tax amortization resulting from the Tax Act and the equity component of allowance for funds used during
construction, partially offset by the tax on gain from the offshore joint venture restructuring transaction (see Note 19 for further
details on the transaction).
The effective tax rates, inclusive of federal and state income tax, for the three and six months ended June 30, 2021, were 10.6%
and 5.6%, respectively. The effective tax rates for the three and six months ended June 30, 2021 are below the federal statutory
tax rate of 21%, primarily due to the recognition of production tax credits associated with wind production and the effect of the
excess deferred tax amortization resulting from the Tax Act.
Note 17. Stock-Based Compensation Expense
The Avangrid, Inc. Amended and Restated Omnibus Incentive Plan (the Plan) provides for, among other things, the issuance of
performance stock units (PSUs), restricted stock units (RSUs) and phantom share units (Phantom Shares).
Performance Stock Units
In February 2020, a total number of 208,268 PSUs, before applicable taxes, were approved to be earned by participants based
on achievement of certain performance metrics related to the 2016 through 2019 plan and are payable in three equal
installments, net of applicable taxes. In March 2022, 46,737 shares of common stock were issued to settle the third and final
installment payment under this plan.
During the six month ended June 30, 2022, 88,718 additional PSUs were granted to certain officers and employees of
AVANGRID. The PSUs will vest upon achievement of certain performance and market-based metrics for the 2021 to 2022
performance period and will be payable in three equal installments, net of applicable taxes, in 2023, 2024 and 2025. The fair
value of the PSUs on the grant date was $36.22 per share. The fair value of the PSUs was determined using valuation
techniques to forecast possible future stock prices, applying a weighted average historical stock price volatility of AVANGRID
and industry companies, a risk-free rate of interest that is equal, as of the grant date, to the yield of the zero-coupon U.S.
Treasury bill and a reduction for the respective dividend yield calculated based on the most recently quarterly dividend payment
and the stock price as of the grant date.
49
Restricted Stock Units
In January 2022, 17,500 RSUs were granted to an officer of AVANGRID with immediate vesting. The fair value on the grant
date was determined based on a price of $48.16 per share. The RSU grant was settled, net of applicable taxes, by issuing 9,390
shares of common stock.
In June 2022, 25,000 RSUs were granted to an officer of AVANGRID. The RSUs vest in two equal installments in 2023 and
2024, provided that the grantee remains continuously employed with AVANGRID through the applicable vesting dates. The
fair value on the grant date was determined based on a price of $47.64 per share.
Phantom Share Units
In March 2020, 167,060 Phantom Shares were granted to certain AVANGRID executives and employees. These awards vest in
three equal installments in 2020, 2021 and 2022 and will be settled in a cash amount equal to the number of Phantom Shares
multiplied by the closing share price of AVANGRID’s common stock on the respective vesting dates, subject to continued
employment. The liability of these awards is measured based on the closing share price of AVANGRID’s common stock at
each reporting date until the date of settlement. In March 2022, $2 million was paid to settle the third and final installment
under this plan.
In February 2022, 9,000 Phantom Shares were granted to certain AVANGRID executives and employees. These awards vest in
three equal installments in 2022 - 2024 and will be settled in a cash amount equal to the number of Phantom Shares multiplied
by the closing share price of AVANGRID’s common stock on the respective vesting dates, subject to continued employment.
The liability of these awards is measured based on the closing share price of AVANGRID’s common stock at each reporting
date until the date of settlement.
As of June 30, 2022 and December 31, 2021, the total liability was $0 and $2 million, respectively, which is included in other
current liabilities.
The total stock-based compensation expense, which is included in "Operations and maintenance" in our condensed consolidated
statements of income, for the three and six months ended June 30, 2022 was $3 and $8 million, respectively, and for the three
and six months ended June 30, 2021 was $5 million and $9 million, respectively.
Note 18. Variable Interest Entities
We participate in certain partnership arrangements that qualify as variable interest entities (VIEs). Consolidated VIE's consist of
tax equity financing arrangements (TEFs) and partnerships in which an investor holds a noncontrolling interest and does not
have substantive kick-out or participating rights.
The sale of a membership interest in the TEFs represents the sale of an equity interest in a structure that is considered a sale of
non-financial assets. Under the sale of non-financial assets, the membership interests in the TEFs we sell to third-party investors
are reflected as noncontrolling interest on our condensed consolidated balance sheets valued based on an HLBV model.
Earnings from the TEFs are recognized in net income attributable to noncontrolling interests in our condensed consolidated
statements of income. We consolidate the entities that have TEFs based on being the primary beneficiary for these VIEs.
On April 29, 2022, we closed on a TEF agreement, receiving $14 million from a tax equity investor related to the Lund Hill
solar farm that reached partial mechanical completion on the same date. A further investment from our investor is expected
shortly after the project’s commercial operations in the amount of $58 million, expected in August. Lund Hill is owned by Solis
Power I, LLC (Solis I).
In June 2022 we received an additional $109 million from a tax equity investor for the addition of Montague solar and Golden
Hill wind farms under Aeolus Wind Power VIII, LLC (Aeolus VIII).
The assets and liabilities of the VIEs totaled approximately $2,799 million and $166 million, respectively, at June 30, 2022. As
of December 31, 2021, the assets and liabilities of VIEs totaled approximately $2,039 million and $119 million, respectively.
At June 30, 2022 and December 31, 2021, the assets and liabilities of the VIEs consisted primarily of property, plant and
equipment.
Wind power generation is subject to certain favorable tax treatments in the U.S. In order to monetize the tax benefits, we have
entered into these structured institutional partnership investment transactions related to certain wind farms. Under these
structures, we contribute certain wind assets, relating both to existing wind farms and wind farms that are being placed into
operation at the time of the relevant transaction, and other parties invest in the share equity of the limited liability holding
company. As consideration for their investment, the third parties make either an upfront cash payment or a combination of
upfront cash and payments over time. We retain a class of membership interest and day-to-day operational and management
50
control, subject to investor approval of certain major decisions. The third-party investors do not receive a lien on any assets and
have no recourse against us for their upfront cash payments.
The partnerships generally involve disproportionate allocations of profit or loss, cash distributions and tax benefits resulting
from the wind farm energy generation between the investor and sponsor until the investor recovers its investment and achieves
a cumulative annual after-tax return. Once this target return is met, the relative sharing of profit or loss, cash distributions and
taxable income or loss between the Company and the third-party investor flips, with the sponsor generally receiving higher
percentages thereafter. We also have a call option to acquire the third-party investors’ membership interest within a defined
time period after this target return is met.
At June 30, 2022, El Cabo Wind, LLC (El Cabo), Patriot Wind Farm LLC (Patriot), Aeolus Wind Power VII, LLC (Aeolus
VII), Aeolus VIII, and Solis I are our consolidated VIEs.
Our El Cabo, Patriot, Aeolus VII, Aeolus VIII, and Solis I interests are not subject to any rights of investors that may restrict
our ability to access or use the assets or to settle any existing liabilities associated with the interests.
See Note 19 - Equity Method Investments for information on our VIE we do not consolidate.
Note 19. Equity Method Investments
Renewables holds a 50% voting interest in Vineyard Wind, LLC (Vineyard Wind), a joint venture with Copenhagen
Infrastructure Partners (CIP). Prior to a restructuring transaction that took place on January 10, 2022, Vineyard Wind held
acquired easements from the U.S. Bureau of Ocean Energy Management (BOEM) containing the rights to develop offshore
wind generation. The first easement area acquired was Lease Area 501 which contains 166,886 acres located southeast of
Martha's Vineyard. Lease Area 501 was subsequently divided in 2021 creating Lease Area 534. In 2018, Vineyard Wind was
selected by the Massachusetts Electric Distribution Companies (EDCs) to construct and operate Vineyard Wind’s proposed 800
MW wind farm (Vineyard Wind 1) and electricity transmission project pursuant to the Massachusetts Green Communities Act
Section 83C RFP for offshore wind energy projects. The Vineyard Wind 1 project will be located on Lease Area 501.
In December 2019, the Park City Wind project was selected and approved to provide 804 MW of offshore wind in Connecticut.
In December 2021, the Commonwealth Wind project was selected to provide 1,232 MW of offshore wind primarily through
contracts with the electric distribution companies in Massachusetts, subject to final regulatory approvals. Both projects are
located in Lease Area 534.
Vineyard Wind acquired a second offshore easement contract from BOEM (Lease Area 522). Renewables initially contributed
$100 million to Vineyard Wind to acquire the easement contract, which was proportionally more than CIP's contribution.
Pursuant to a joint bidding agreement between Renewables and CIP, CIP had the option to reimburse Renewables an amount,
plus interest, to restore its 50% interest in the easement contract. In December 2020, CIP exercised this option and reimbursed
Renewables $33 million, plus interest.
On September 15, 2021, Vineyard Wind closed on construction financing for the Vineyard Wind 1 project. Among other items,
the Vineyard Wind 1 project was transferred into a separate joint venture with Vineyard Wind 1 Pledgor LLC as the top holding
company, which Renewables holds a 50% voting interest. Concurrently, Renewables entered into a credit agreement with
certain banks to provide future term loans and letters of credit up to a maximum of approximately $1.2 billion to finance a
portion of its share of the cost of Vineyard Wind 1 at the maturity of the Vineyard Wind 1 project construction loan. Any term
loans mature by October 15, 2031, subject to certain extension provisions. Renewables also entered into an Equity Contribution
Agreement in which Renewables agreed to, among other things, make certain equity contributions to fund certain costs of
developing and constructing the Vineyard Wind 1 project in accordance with the credit agreement. In addition, we issued a
guaranty up to $827 million for Renewables' equity contributions under the Equity Contribution Agreement. As part of the
Vineyard Wind 1 financial close, $152 million of Renewables prior contributions for the Vineyard Wind 1 project were
returned.
On September 15, 2021, Renewables entered into a restructuring agreement with CIP with respect to Vineyard Wind. The
restructuring closed on January 10, 2022 and effectively dissolved Vineyard Wind. As part of the restructuring, Renewables
acquired full ownership of Park City Wind LLC containing Lease Area 534, including the Park City Wind project and
Commonwealth Wind project in Lease Area 534, and CIP acquired OCS-A 0522 LLC containing Lease Area 522. Immediately
following Vineyard Wind's dissolution of interests in Park City Wind LLC and OCS-A 0522 LLC, Vineyard Wind solely
provides construction and management services to Vineyard Wind 1, which are outsourced to third party service providers, and
no longer owns the rights to any lease areas, and therefore no longer has substantive operations. As part of the restructuring and
effective dissolution, Renewables received a liquidating distribution and made an incremental payment of approximately
$168 million to CIP. Consequently, Renewables recognized a pretax gain of $246 million and an after tax gain of $181 million,
51
driven by the increase in the market value of its acquired interest in the leases and related development activities over its
carrying value. The gain is classified in Earnings from equity method investments in the condensed consolidated statement of
income.
Vineyard Wind 1 Pledgor LLC is considered a VIE because it cannot finance its activities without additional support from its
owners or third parties. Renewables is not the primary beneficiary of the entity since it does not have a controlling financial
interest, and therefore we do not consolidate this entity. As of June 30, 2022 and December 31, 2021, the carrying amount of
Renewables' investments in Vineyard Wind LLC and Vineyard Wind 1 Pledgor LLC was $10 million and $141 million,
respectively.
Note 20. Subsequent Event
On July 20, 2022, the board of directors of AVANGRID declared a quarterly dividend of $0.44 per share on its common stock.
This dividend is payable on October 3, 2022 to shareholders of record at the close of business on September 2, 2022.
52
Item 2. Management’s Discussion and Analysis of Financial Condition and Results of Operations
You should read the following discussion of our financial condition and results of operations in conjunction with the condensed
consolidated financial statements and the notes thereto included elsewhere in this Quarterly Report on Form 10-Q and with our
audited consolidated financial statements as of December 31, 2021 and 2020, and for the three years ended December 31,
2021, included in our Annual Report on Form 10-K for the year ended December 31, 2021, filed with the Securities and
Exchange Commission, or the SEC, on February 23, 2022, which we refer to as our “Form 10-K.” In addition to historical
condensed consolidated financial information, the following discussion contains forward-looking statements that reflect our
plans, estimates and beliefs. Our actual results could differ materially from those discussed in the forward-looking statements.
The foregoing and other factors are discussed and should be reviewed in our Form 10-K and other subsequent filings with the
SEC.
Overview
AVANGRID aspires to be the leading sustainable energy company in the United States. Our purpose is to work every
day to deliver a more accessible clean energy model that promotes healthier, more sustainable communities. A commitment to
sustainability is firmly entrenched in the values and principles that guide AVANGRID, with environmental, social, governance
and financial sustainability key priorities driving our business strategy.
AVANGRID has approximately $40 billion in assets and operations in 24 states concentrated in our two primary lines of
business - Avangrid Networks and Avangrid Renewables. Avangrid Networks owns eight electric and natural gas utilities,
serving approximately 3.3 million customers in New York and New England. Avangrid Renewables owns and operates 9.0
gigawatts of electricity capacity, primarily through wind and solar power, with a presence in 22 states across the United States.
AVANGRID supports the achievement of the Sustainable Development Goals approved by the member states of the United
Nations, was named among the World’s Most Ethical companies in 2022 for the fourth consecutive year by the Ethisphere
Institute and is listed by Forbes and Just Capital as one of the 2022 Just 100, an annual ranking of the most just U.S. public
companies. AVANGRID employs approximately 7,300 people. Iberdrola S.A., or Iberdrola, a corporation (sociedad anónima)
organized under the laws of the Kingdom of Spain, a worldwide leader in the energy industry, directly owns 81.6% of the
outstanding shares of AVANGRID common stock. The remaining outstanding shares are owned by various shareholders with
approximately 18.4% of AVANGRID's outstanding shares publicly-traded on the New York Stock Exchange (NYSE).
AVANGRID's primary businesses are described below.
Our direct, wholly-owned subsidiaries include Avangrid Networks, Inc., or Networks, and Avangrid Renewables
Holdings, Inc., or ARHI. ARHI in turn holds subsidiaries including Avangrid Renewables, LLC, or Renewables. Networks
owns and operates our regulated utility businesses through its subsidiaries, including electric transmission and distribution and
natural gas distribution, transportation and sales. Renewables operates a portfolio of renewable energy generation facilities
primarily using onshore wind power and also solar, biomass and thermal power.
Through Networks, we own electric distribution, transmission and generation companies and natural gas distribution,
transportation and sales companies in New York, Maine, Connecticut and Massachusetts, delivering electricity to
approximately 2.3 million electric utility customers and delivering natural gas to approximately 1.0 million natural gas utility
customers as of June 30, 2022.
Networks, a Maine corporation, holds regulated utility businesses, including electric transmission and distribution and
natural gas distribution, transportation and sales. Networks serves as a super-regional energy services and delivery company
through the eight regulated utilities it owns directly:
• New York State Electric & Gas Corporation, or NYSEG, which serves electric and natural gas customers across
more than 40% of the upstate New York geographic area;
• Rochester Gas and Electric Corporation, or RG&E, which serves electric and natural gas customers within a
nine-county region in western New York, centered around Rochester;
• The United Illuminating Company, or UI, which serves electric customers in southwestern Connecticut;
• Central Maine Power Company, or CMP, which serves electric customers in central and southern Maine;
• The Southern Connecticut Gas Company, or SCG, which serves natural gas customers in Connecticut;
• Connecticut Natural Gas Corporation, or CNG, which serves natural gas customers in Connecticut;
• The Berkshire Gas Company, or BGC, which serves natural gas customers in western Massachusetts; and
• Maine Natural Gas Corporation, or MNG, which serves natural gas customers in several communities in central
and southern Maine.
53
Renewables has a combined wind, solar and thermal installed capacity of 9,016 megawatts, or MW, as of June 30, 2022,
including Renewables’ share of joint projects, of which 8,007 MW was installed wind capacity. Renewables targets to contract
or hedge 85% to 95% of its capacity under long-term PPAs and hedges to limit market volatility. As of June 30, 2022,
approximately 74% of the capacity was contracted with PPAs for an average period of approximately 10 years and an
additional 14% of production was hedged. AVANGRID is one of the three largest wind operators in the United States based on
installed capacity as of June 30, 2022, Renewables strives to lead the transformation of the U.S. energy industry to a
sustainable, competitive, clean energy future. Renewables installed capacity includes 66 wind farms and four solar facilities in
21 states across the United States.
Texas Weather Event
During February 2021, Texas and the surrounding region experienced unprecedented extreme cold weather, resulting in
outages impacting millions in the state. Avangrid Renewables safely operated our Texas wind generation facilities during this
event meeting all of our delivery obligations in Texas and producing excess energy that was sold based on the rules established
at the time by the Energy Reliability Council of Texas, or ERCOT. If the received payments are adjusted by ERCOT, it could
adversely affect our results of operations.
In connection with the Texas Weather Event, a number of plaintiffs have filed multiple cases against generators and
natural gas suppliers, including certain Avangrid Renewables entities in Texas, alleging liability for injuries and damages
arising from the event under a variety of legal theories. The plaintiffs have amended many of their petitions within the
multidistrict litigation, and more than 100 of the cases now name Avangrid Renewables entities among the defendants. Four of
the consolidated cases have been designated as “bellwether” cases and are proceeding to resolve certain common issues of fact
and law. In May 2022, the Avangrid Renewables entities were part of a broader motion to dismiss by all generators in the
bellwether cases in which they were named. We cannot predict the outcome of these matters.
Proposed Merger with PNMR
On October 20, 2020, AVANGRID, PNM Resources, Inc., a New Mexico corporation, or PNMR, and NM Green
Holdings, Inc., a New Mexico corporation and wholly-owned subsidiary of AVANGRID, or Merger Sub, entered into an
Agreement and Plan of Merger, or Merger Agreement, pursuant to which Merger Sub is expected to merge with and into
PNMR, with PNMR surviving the Merger as a direct wholly-owned subsidiary of AVANGRID, or the Merger. PNMR is a
publicly-owned holding company with two regulated utilities providing electricity and electric services in New Mexico and
Texas. PNMR's electric utilities are the Public Service Company of New Mexico and the Texas-New Mexico Power Company.
Following consummation of the Merger, AVANGRID will expand its geographic and regulatory diversity with ten regulated
electric and gas companies in six states to help expand our growing leadership position in transforming the U.S. energy
industry.
Pursuant to the Merger Agreement, each issued and outstanding share of the common stock of PNMR (other than (i) the
issued shares of PNMR common stock that are owned by AVANGRID, Merger Sub, PNMR or any wholly-owned subsidiary
of AVANGRID or PNMR, which will be automatically cancelled at the time the Merger is consummated and (ii) shares of
PNMR common stock held by a holder who has not voted in favor of, or consented in writing to, the Merger who is entitled to,
and who has demanded, payment for fair value of such shares) will be converted, at the time the Merger is consummated, into
the right to receive $50.30 in cash, or Merger Consideration, or approximately $4.3 billion in aggregate consideration. In
connection with the Merger, Iberdrola has provided the Iberdrola Funding Commitment Letter, pursuant to which Iberdrola has
unilaterally agreed to provide to AVANGRID, or arrange the provision to AVANGRID of, funds to the extent necessary for
AVANGRID to consummate the Merger, including the payment of the aggregate Merger Consideration.
On April 15, 2021, AVANGRID entered into a side letter agreement with Iberdrola, which sets forth certain terms and
conditions relating to the Funding Commitment Letter (the Side Letter Agreement). The Side Letter Agreement provides that
any drawing in the form of indebtedness made by AVANGRID pursuant to the Funding Commitment Letter shall bear interest
at an interest rate equal to 3-month LIBOR plus 0.75% per annum calculated on the basis of a 360-day year for the actual
number of days elapsed and, commencing on the date of the Funding Commitment Letter, we shall pay Iberdrola a facility fee
equal to 0.12% per annum on the undrawn portion of the funding commitment set forth in the Funding Commitment Letter.
On February 12, 2021, the shareholders of PNMR approved the proposed Merger. As of November 1, the Merger had
obtained all regulatory approvals other than from the NMPRC. On November 1, 2021, after public hearing and briefing on the
matter, the hearing examiner in the Merger proceeding at the NMPRC issued an unfavorable recommendation related to the
amended stipulated agreement entered into by PNMR, AVANGRID and several interveners in the NMPRC proceeding with
respect to consideration of the joint Merger application in June 2021. On December 8, 2021, the NMPRC issued an order
rejecting the amended stipulated agreement. On January 3, 2022, AVANGRID and PNMR filed a notice of appeal of the
December 8, 2021 decision of the NMPRC with the New Mexico Supreme Court. The Statement of Issues was filed on
February 2, 2022 and the Brief in Chief was filed on April 7, 2022. On June 14, 2022, the NMPRC filed its Answer Brief. On
54
June 13, 2022, New Energy Economy, an intervener in the Merger proceeding, filed its Answer Brief. AVANGRID's Reply
Brief is due on August 5, 2022 (pending any additional extensions granted to the parties). On February 24, 2022, the FCC
granted an extension to its approval to transfer operating licenses in connection with the Merger.
In addition, on January 3, 2022, AVANGRID, PNMR and Merger Sub entered into an Amendment to the Merger
Agreement, or the Amendment, pursuant to which Avangrid, PNMR and Merger Sub each agreed to extend the “End Date” for
consummation of the Merger until April 20, 2023. The parties acknowledge in the Amendment that the required regulatory
approval from the New Mexico Public Regulation Commission, or NMPRC, has not been obtained and that the parties have
reasonably determined that such outstanding approval will not be obtained by April 20, 2022. In light of this outstanding
approval, the parties determined to approve the Amendment. As amended, the Merger Agreement may be terminated by each of
Avangrid and PNMR under certain circumstances, including if the Merger is not consummated by April 20, 2023 (subject to a
three-month extension by Avangrid and PNMR by mutual consent if all of the conditions to the closing, other than the
conditions related to obtaining regulatory approvals, have been satisfied or waived). During the pendency of this appeal certain
required regulatory approvals and consents may expire and AVANGRID and PNMR will reapply and/or apply for extensions of
such approvals, as the case may be. We cannot predict the outcome of this proceeding for the outstanding approvals.
The Merger Agreement contains representations, warranties and covenants of PNMR, AVANGRID and Merger Sub,
which are customary for transactions of this type. In addition, among other things, the Merger Agreement contains a covenant
requiring PNMR to, prior to the closing, enter into agreements (Four Corners Divestiture Agreements) providing for, and to
make filings required to, exit from all ownership interests in the Four Corners Power Plant, all with the objective of having the
closing date for such exit be no later than December 31, 2024.
The Merger Agreement (as amended) provides for certain customary termination rights including the right of either party
to terminate the Merger Agreement if the Merger is not completed on or before April 20, 2023 (subject to a three-month
extension by Avangrid and PNMR by mutual consent if all of the conditions to the closing, other than the conditions related to
obtaining regulatory approvals, have been satisfied or waived). The Merger Agreement further provides that, upon termination
of the Merger Agreement under certain specified circumstances (including if AVANGRID terminates the Merger Agreement
due to a change in recommendation of the board of directors of PNMR or if PNMR terminates the Merger Agreement to accept
a superior proposal (as defined in the Merger Agreement)), PNMR will be required to pay AVANGRID a termination fee of
$130 million. In addition, the Merger Agreement provides that (i) if the Merger Agreement is terminated by either party due to
a failure of a regulatory closing condition and such failure is the result of AVANGRID’s breach of its regulatory covenants, or
(ii) AVANGRID fails to effect the Closing when all closing conditions have been satisfied and it is otherwise obligated to do so
under the Merger Agreement, then, in either such case, upon termination of the Merger Agreement, AVANGRID will be
required to pay PNMR a termination fee of $184 million as the sole and exclusive remedy. Upon the termination of the Merger
Agreement under certain specified circumstances involving a breach of the Merger Agreement, either PNMR or AVANGRID
will be required to reimburse the other party’s reasonable and documented out-of-pocket fees and expenses up to $10 million
(which amount will be credited toward, and offset against, the payment of any applicable termination fee).
In connection with the Merger, Iberdrola has provided AVANGRID a commitment letter (Iberdrola Funding
Commitment Letter), pursuant to which Iberdrola has unilaterally agreed to provide to AVANGRID, or arrange the provision to
AVANGRID of, funds to the extent necessary for AVANGRID to consummate the Merger, including the payment of the
aggregate Merger Consideration.
Business Environment
The COVID-19 pandemic continues to cause global economic disruption and volatility in financial markets and the
United States economy. We continue to monitor developments affecting both our workforce and our customers and will take
precautions that we determine are necessary or appropriate, regularly communicate with our customers regarding the tools and
resources available and to help our customers stay informed during this public health crisis, and continue to actively monitor
potential supply chain and transportation disruptions that could impact the Company’s operations and will implement plans to
address any such impacts on our business. In addition, we are experiencing changes in inflation levels resulting from various
supply chain disruptions, increased business and labor costs, increased financing costs from changes in the Federal Reserve's
monetary policy and other disruptions caused by global economic conditions, including the COVID-19 pandemic and the
Russia and Ukraine conflict described below. We have not yet experienced a materially adverse impact to our business, results
of operations or financial condition, however, given the uncertain scope and duration of the COVID-19 outbreak or global
economic trends and its potential effects on our business, we currently cannot predict if there will be materially adverse impacts
to our business, results of operations or financial condition in the future.
In February 2022, Russia invaded Ukraine resulting in the United States, Canada, the European Union and other
countries imposing economic sanctions on Russia. AVANGRID is monitoring the broader economic impact of this conflict,
which may include further sanctions, supply chain instability, and potential retaliatory action by the Russian government
55
against us. AVANGRID is taking steps intended to mitigate the potential risks from this continued conflict. To date, there has
been no material impact on our operations or financial performance as a result of the conflict; however, we cannot predict the
extent of these effects, given the evolving nature of the conflict, on our business, results of operations or financial condition.
AVANGRID is monitoring the Department of Commerce's, or DOC, anti-circumvention petition alleging that solar
panels and cells shipped from Vietnam, Thailand, Malaysia and Cambodia have circumvented tariffs imposed on Chinese solar
panels and cells. The petition calls for anti-dumping and countervailing duties to be applied to solar panels and cells and could
be retroactive to the filing date. In June 2022, President Joe Biden's Administration announced a 24-month tariff exemption on
any potential tariff resulting from the anti-circumvention investigation. Renewables is taking steps intended to mitigate
potential risks to their solar project development portfolio. To date, there has been no material impact on Renewables'
operations or financial performance as a result of this investigation. Despite the 24-month tariff exemption, there is uncertainty
around the final resolution by the DOC and related long-term effects to the solar panel supply chain and we currently cannot
predict if there will be materially adverse impacts to our business, results of operations or financial condition.
AVANGRID is also monitoring the Coast Guard Authorization Act of 2022 that was passed by the United States House
of Representatives in March 2022 and the National Defense Authorization Act that was passed by the United States House of
Representatives in mid-July. If enacted, the bills may only allow foreign vessels to operate on the Outer Continental Shelf if
they have (a) a U.S. crew or (b) the crew of the nation of which the vessel is from. If passed, the legislation could affect
expected timelines and returns on approved projects. To date, there has been no material impact on Renewables' operations or
financial performance as a result of these bills; however, given the uncertainty of resolution of the final legislation and the
related effects to our offshore projects, we currently cannot predict if there will be materially adverse impacts to our business,
results of operations or financial condition.
There are a limited number of turbine suppliers in the market. Renewables’ largest turbine suppliers, Siemens-Gamesa
and GE Wind, are engaged in an intellectual property dispute with respect to certain offshore wind turbines. To date, there has
been no material impact on Renewables' operations or turbine procurement; however, we are monitoring this dispute and we
cannot predict if there will be materially adverse impacts to our business, results of operations or financial condition.
Summary of Results of Operations
Our operating revenues increased by 21%, from $1,477 million for the three months ended June 30, 2021 to $1,794
million for the three months ended June 30, 2022.
Networks business revenues increased mainly due to rate increases in New York effective December 1, 2020.
Renewables revenues increased mainly due to favorable mark to market, or MtM, changes on energy derivative transactions
entered into for economic hedging purposes and higher curtailment payments.
Net income attributable to AVANGRID increased by 88% from $98 million for the three months ended June 30, 2021 to
$184 million for the three months ended June 30, 2022, primarily due to higher Networks revenues from the New York rate
case activity.
Adjusted net income (a non-GAAP financial measure) increased by 46% from $122 million for the three months ended
June 30, 2021 to $178 million for the three months ended June 30, 2022. The increase is primarily due to a $26 million increase
in Renewables driven primarily by favorable production, including new assets in service and curtailment payments, and
favorable impacts from our tax equity partnerships in the current period, a $21 million increase in Networks driven primarily by
new rate case activity in New York which was approved November 19, 2020, an $11 million impact from the arrearages order
in New York, and $9 million decrease in Corporate mainly driven by favorable tax expense in the period.
For additional information and reconciliation of the non-GAAP adjusted net income to net income attributable to
AVANGRID, see “—Non-GAAP Financial Measures”.
See “—Results of Operations” for further analysis of our operating results for the quarter.
Legislative and Regulatory Update
We are subject to complex and stringent energy, environmental and other laws and regulations at the federal, state and
local levels as well as rules within the independent system operator, or ISO, markets in which we participate. Federal and state
legislative and regulatory actions continue to change how our business is regulated. We actively participate in the regulatory
process at the federal, regional, state and ISO levels. Significant updates are discussed below. For a further discussion of the
environmental and other governmental regulations that affect us, see our Form 10-K for the year ended December 31, 2021.
56
Customer Disconnections
Due to the COVID-19 pandemic, all of our regulated utilities suspended customer disconnections commencing in March
2020. In New York, we had voluntarily suspended disconnections for non-payment. The New York state legislature passed a
bill stating moratoriums on residential customer disconnections shall remain in place until 180 days after the COVID-19 state of
emergency in New York is lifted, which occurred on June 24, 2021. Due to the winter disconnection moratorium period,
disconnections did not resume until April 2022.
CMP Metering and Billing Investigation
On February 19, 2020, the MPUC issued an order in CMP’s distribution rate case proceeding and on February 24, 2020
issued an order in the metering and billing investigation. Each order reflected the MPUC’s conclusion that CMP’s Metering and
Billing system is accurately reporting data, there is no systemic root cause for high usage complaints and errors related to
CMP’s metering and billing system are localized and random, not systemic. However, the MPUC orders imposed a reduction of
100 basis points in ROE, as a management efficiency adjustment, to address the MPUC Commissioners’ concerns with CMP’s
customer service implementation and performance following the launch of its new billing system in 2017, which would be
removed after demonstrating satisfactory customer service performance. In September 2021, CMP met the 18-month required
rolling average satisfactory customer service benchmarks and filed with the MPUC a request for removal of the management
efficiency adjustment, which was approved by the MPUC effective as of its February 18, 2022 order.
CMP Standard Offer Uncollectible Adder Investigation
On August 19, 2020, the MPUC issued a Notice of Investigation to open an investigation into whether the uncollectible
adder to CMP’s standard offer retainage account for the residential and small non-residential standard offer customer class
should be increased for standard offer electricity-supply rates that go into effect January 1, 2022. The investigation also
included a review of CMP’s credit and collection practices.
On June 22, 2021, CMP and the Maine Office of the Public Advocate executed and filed with the MPUC a Stipulation
resolving all matters in this proceeding, which requires CMP to credit the residential and small non-residential standard-offer
retainage account for $4 million. On June 29, 2021, the MPUC issued an Order Approving Stipulation pursuant to which the
MPUC approved the Stipulation and closed the investigation.
Power Tax Audits
Previously, CMP, NYSEG and RG&E implemented Power Tax software to track and measure their respective deferred
tax amounts. In connection with this change, we identified historical updates needed with deferred taxes recognized by CMP,
NYSEG and RG&E and increased our deferred tax liabilities, with a corresponding increase to regulatory assets, to reflect the
updated amounts calculated by the Power Tax software. Since 2015, the NYPSC and MPUC accepted certain adjustments to
deferred taxes and associated regulatory assets for this item in recent distribution rate cases, resulting in regulatory asset
balances of approximately $139 million and $142 million, respectively, for this item at June 30, 2022 and December 31, 2021.
CMP began recovering its regulatory asset in 2020. In 2017, the NYPSC commenced an audit of the power tax
regulatory assets. On January 11, 2018, the NYPSC issued an order opening an operations audit on NYSEG and RG&E and
certain other New York utilities regarding tax accounting. NYSEG and RG&E received the auditors confidential draft report in
May 2022 and are responding to the report’s factual accuracy. NYSEG and RG&E expect the final report to be issued in 2023
and cannot predict the outcome of the final report.
New England Clean Energy Connect
The NECEC project requires certain permits, including environmental, from multiple state and federal agencies and a
presidential permit from the U.S. Department of Energy, or DOE, authorizing the construction, operation, maintenance and
connection of facilities for the transmission of electric energy at the international border between the United States and Canada.
On January 8, 2020, the Maine Land Use Planning Commission, or LUPC, granted the LUPC Certification for the NECEC. The
Maine Department of Environmental Protection, or MDEP, granted Site Location of Development Act, Natural Resources
Protection Act, and Water Quality Certification permits for the NECEC by an Order dated May 11, 2020. The MDEP Order
was appealed by certain intervenors. On July 21, 2022, the Maine Board of Environmental Protection, or BEP, denied the
appeals of the MDEP Order, as well as the appeal of MDEP’s December 4, 2020 Order approving the transfer of the permits for
the project to NECEC Transmission LLC. In addition, certain intervenors have appealed MDEP’s May 7, 2021 Order approving
certain minor revisions. This appeal remains pending before the BEP. We cannot predict the outcome of these proceedings.
On November 6, 2020, the project received the required approvals from the U.S. Army Corps of Engineers, or Army
Corps, pursuant to Section 10 of the Rivers and Harbor Act of 1899 and Section 404 of the Clean Water Act. A complaint for
57
declaratory and injunctive relief asking the court to, among other things, vacate or remand the Section 404 Clean Water Act
permit for the NECEC project filed by three environmental groups is currently pending before the District Court in Maine.
ISO-NE issued the final System Impact Study (SIS) for NECEC on May 13, 2020, determining the upgrades required to
permit the interconnection of NECEC to the ISO-NE system. On July 9, 2020, the project received the formal I.3.9 approval
associated with this interconnection request. CMP, NECEC Transmission LLC and ISO-NE executed an interconnection
agreement. With respect to the upgrade required at the Seabrook Station, on October 13, 2020, AVANGRID and NECEC
Transmission LLC filed a complaint with the FERC and an amended complaint on March 26, 2021. On October 5, 2020,
NextEra Energy Seabrook, LLC filed a petition for declaratory order. Both proceedings are currently pending before FERC. We
cannot predict the outcome of these proceedings.
On January 14, 2021, the DOE issued a Presidential Permit granting permission to NECEC Transmission LLC to
construct, operate, maintain and connect electric transmission facilities at the international border of the United States and
Canada. On March 26, 2021, the plaintiffs challenging the Army Corps permit filed a motion for leave before the District Court
in Maine to supplement their complaint to add claims against DOE in connection with the Presidential Permit. On April 20,
2021, the District Court granted the plaintiffs motion to amend the complaint. On April 22, 2021 the plaintiffs filed their
amended complaint asking the Court, among other things, to vacate, set aside, remand or stay the Presidential Permit. This
challenge to the Presidential Permit is currently pending before the District Court in Maine. We cannot predict the outcome of
this proceeding.
On August 10, 2021, the Maine Superior Court issued a ruling reversing the Maine Bureau of Parks and Lands’, or BPL,
decision to grant a lease over a small area of public reserved lands to host a small section of the NECEC project. On August 13,
2021, BPL, and NECEC Transmission LLC appealed this ruling and prior decisions and orders in the case. The appeal is
currently pending before the Maine Supreme Judicial Court sitting as the Law Court, or the Maine Law Court. As a result of the
appeal, the Maine Superior Court decision vacating the lease is stayed. On September 15, 2021, the Maine Law Court ordered
NECEC Transmission LLC to refrain from construction activities on the public reserved lands lease area during the pendency
of the appeal. Oral argument before the Law Court is scheduled for May 10, 2022. We cannot predict the outcome of this
proceeding.
On November 2, 2021, Maine voters approved, by virtue of a referendum, L.D. 1295 (I.B. 1) (130th Legis. 2021), “An
Act To Require Legislative Approval of Certain Transmission Lines, Require Legislative Approval of Certain Transmission
Lines and Facilities and Other Projects on Public Reserved Lands and Prohibit the Construction of Certain Transmission Lines
in the Upper Kennebec Region” (the “Initiative”). The Initiative (i) requires, retroactive to 2020, legislative approval for the
construction of any high-impact transmission line in Maine, with approval by a 2/3 vote of all members elected to each House
of the Maine Legislature required for such lines crossing or utilizing public lands; (ii) prohibits, retroactive to 2020,
construction of a high-impact electric transmission line in the Upper Kennebec Region and (iii) requires, retroactive to 2014,
the vote of 2/3 of all members elected to each House of the Maine Legislature for a lease by BPL of public reserved lands for
transmission lines and similar linear projects.
On November 3, 2021, Networks and NECEC Transmission LLC filed a lawsuit challenging the constitutionality of the
Initiative and requesting injunctive relief preventing retroactive enforcement of the Initiative to the NECEC transmission
project. Networks and NECEC Transmission LLC also requested a preliminary injunction preventing such retroactive
enforcement during the pendency of the lawsuit.
On November 23, 2021, the MDEP issued an Order finding that the Initiative constitutes a changed circumstance
justifying the suspension of the MDEP permits for the NECEC project. This MDEP-ordered suspension will remain effective
unless and until a court grants Networks and NECEC Transmission LLC’s request for a preliminary injunction and allows
continued construction of the NECEC project pending the final outcome of the legal challenge to the Initiative, or, if a court
does not grant a preliminary injunction, until final disposition of the legal challenge in favor of Networks and NECEC
Transmission LLC. In its order, the MDEP ruled that, so long as such MDEP permits are suspended, all construction must stop,
subject to the performance and completion of certain activities required by the Order. The MDEP also stated in its Order that in
the event that the current ordered suspension ended, it would promptly consider whether to suspend the MDEP permits for the
NECEC in light of the ruling from the Maine Superior Court reversing BPL’s decision to grant a lease over public reserved
lands for the NECEC project.
On December 16, 2021, the Maine Business & Consumer Court denied Networks and NECEC Transmission LLC’s
request for a preliminary injunction temporarily precluding application of the Initiative to the NECEC transmission project. The
Initiative took effect on December 19, 2021. On December 22, 2021, Networks and NECEC Transmission LLC moved that the
Business & Consumer Court report its decision to the Maine Law Court for an interlocutory appeal under the applicable rule of
appellate procedure. On December 28, 2021, the Business & Consumer Court granted this motion, thereby sending its decision
to the Law Court for review. Briefing on the report is complete and oral argument before the Law Court took place on May 10,
2022. We cannot predict the outcome of these proceedings.
58
At the municipal level, twenty-one towns have granted municipal approvals to date.
Construction of the NECEC project started in January 2021 and was halted in November 2021. Construction remains
stopped pending a decision by the Maine Law Court on the report of the Business & Consumer Court decision that denied
Networks and NECEC Transmission LLC’s request for preliminary injunction preventing enforcement of the Initiative against
the NECEC project during the pendency of the challenge against the Initiative. NECEC Transmission LLC has communicated
to the counterparties to its agreements, including, without limitation, vendors, suppliers and TSA parties, the suspension of the
MDEP permit, the Initiative and the status of the pending challenge. There are potentially adverse implications arising out of
the suspension of the MDEP permit, the Initiative and the pending challenge, which may have negative impacts on the NECEC
project, including impacts related to increased project construction costs and a decrease in expected returns. We cannot predict
the outcome of the pending challenge against the Initiative. The company estimates a commercial operation date in December
2024, assuming construction activities resume in 2022. As of June 30, 2022, we have capitalized approximately $575 million
for the NECEC project. The outcome of these ongoing legal proceedings could have an adverse effect on the success of the
NECEC project indicating that the carrying amount may not be recoverable. We cannot predict the outcome of these
proceedings and the results of such evaluation, if any.
PURA Investigation of the Preparation for and Response to the Tropical Storm Isaias
On August 6, 2020, PURA opened a docket to investigate the preparation for and response to Tropical Storm Isaias by
the electric distribution companies in Connecticut including UI. Following hearings and the submission of testimony, PURA
issued a final decision on April 15, 2021, finding that UI “generally met standards of acceptable performance in its preparation
and response to Tropical Storm Isaias," subject to certain exceptions noted in the decision, but ordered a 15-basis point
reduction to UI's ROE in its next rate case to incentivize better performance and indicated that penalties could be forthcoming
in the penalty phase of the proceedings. On June 11, 2021, UI filed an appeal of PURA’s decision with the Connecticut
Superior Court.
On May 6, 2021, in connection with its findings in the Tropical Storm Isaias docket, PURA issued a Notice of Violation
to UI for allegedly failing to comply with standards of acceptable performance in emergency preparation or restoration of
service in an emergency and with orders of the Authority, and for violations of accident reporting requirements. PURA assessed
a civil penalty in the total amount of $2 million. PURA held a hearing on this matter and, in an order dated July 14, 2021,
reduced the civil penalty to approximately $1 million. UI filed an appeal of PURA’s decision with the Connecticut Superior
Court. This appeal and the appeal of PURA’s decision on the Tropical Storm Isaias docket have been consolidated. We cannot
predict the outcome of these appeals.
Connecticut Energy Legislation
On October 7, 2020, the Governor of Connecticut signed into law an energy bill that, among other things, instructs
PURA to revise the rate-making structure in Connecticut to adopt performance-based rates for each electric distribution
company, increases the maximum civil penalties assessable for failures in emergency preparedness, and provides certain
penalties and reimbursements to customers after storm outages greater than 96 hours, and extends rate case timelines.
Pursuant to the legislation, on October 30, 2020, PURA re-opened a docket related to new rate designs and review,
expanding the scope to consider (a) the implementation of an interim rate decrease; (b) low income rates; and (c) economic
development rates. Separately, UI was due to make its annual rate adjustment mechanism, or RAM, filing on March 8, 2021 for
the approval of its RAM Rate Components reconciliations: Generation Services Charges, By-passable Federally Mandated
Congestion Costs, System Benefits Charge, Transmission Adjustment Charge and Revenue Decoupling Mechanism.
On March 9, 2021, UI, jointly with the Office of the CT Attorney General, the Office of CT Consumer Counsel, DEEP
and PURA’s Office of Education, Outreach, and Enforcement entered into a settlement agreement and filed a motion to approve
the settlement agreement, which addressed issues in both dockets.
In an order dated June 23, 2021, PURA approved the as amended settlement agreement in its entirety and it was executed
by the parties. The settlement agreement includes a contribution by UI of $5 million and provides customers rate credits of
$50 million while allowing UI to collect $52 million in RAM, all over a 22-month period ending April 2023 and also includes a
distribution base rate freeze through April 2023.
Also, pursuant to the legislation, PURA opened a docket to consider the implementation of the associated customer
compensation and reimbursement provisions in emergency events where customers were without power for more than 96
consecutive hours. On June 30, 2021, PURA issued a final decision implementing the legislative mandate to create a program
pursuant to which residential customers will receive $25 for each day without power after 96 hours and also receive
reimbursement of $250 for spoiled food and medicine. The decision emphasizes that no costs incurred in connection with this
program are recoverable from customers.
59
Proposed New York Legislation in Response to the Tropical Storm Isaias
Proposed legislation has been introduced that would amend the public service law to, among other things, increase
potential penalties and give greater discretion to the NYPSC to assess penalties for violations of the Public Service Law,
Regulations, or Orders of the NYPSC. We cannot predict the outcome of this proposed legislation.
CMP Generator Interconnection Investigation
On February 10, 2021, two solar developer associations petitioned the MPUC to open an investigation into CMP’s
generator interconnection practices and the estimates CMP provided to developers related to expected interconnection costs. On
April 6, 2021, the MPUC issued a Notice of Formal Investigation related to the prudency and reasonableness of CMP’s actions
with respect to the interconnection of generation to its distribution system. The Hearing Examiners in the matter have issued a
procedural order setting a discovery schedule, CMP has responded to data requests and a technical conference has been
conducted. On September 21, 2021, the MPUC staff issued a Bench Memorandum providing the staff’s assessment (i) whether
CMP has followed a course of conduct that a capably managed utility would have followed in light of existing and reasonably
knowable circumstances and (ii) if not, what steps should be taken, including penalties and changes to ensure that CMP acts
reasonably on a forward going basis. In the Bench Memorandum, staff found that CMP’s conduct, and related management
actions and inactions, raise significant issues regarding prudency. Specifically, staff found that CMP did not adequately prepare
for the large volume of generator interconnection applications that resulted from “An Act To Promote Solar Energy Projects
and Distributed Generation Resources in Maine”, enacted by the Maine legislature in 2019. MPUC staff recommends that the
MPUC require that CMP to file a detailed plan to better integrate planning across relevant departments in the generator
interconnection process with the MPUC. CMP’s response to the Bench Memorandum was filed on October 12, 2021. On
January 11, 2022, an uncontested Stipulation settling this matter and two other dockets was filed with the MPUC. All but two
parties to the three proceedings joined the Stipulation and the two non-signatory parties do not oppose the Stipulation. In the
Stipulation, among other things, the Stipulating Parties agree to support resolution of all issues, that CMP shall pay $150,000 to
be used to support a facilitator for the MPUC’s DG Interconnection Working Group for a period of two years and $550,000 to
fund up to six contracted analyst resources to support the interconnection process for a period of two years. Also, CMP has
agreed to meet certain published cluster study timelines subject to qualifications set forth in the Stipulation. On March 22, 2022,
the MPUC approved the Stipulation.
Maine Government-Run Power Referendum and Legislation to Ensure Utility Accountability
On September 18, 2020, a request was submitted to the Maine Secretary of State to initiate the process of placing a
government-run power referendum on the ballot. The proponents did not submit signatures in January 2022, the deadline to
place the referendum on the November 2022 ballot, but have made statements that they intend to continue to collect sufficient
signatures to present the referendum in a general election. We cannot predict the outcome of this request or any potential
referendum.
In February 2022, a bill, L.D. 1959, An Act To Ensure Transmission and Distribution Utility Accountability was
introduced in the Maine Legislature. The bill provides additional Maine PUC requirements on Maine large electric utilities,
including CMP, to ensure customer service and reliability. The bill imposes penalties for poor performance, adds more
protection for whistleblowers who report illegal or improper behavior by a utility, authorizes the PUC to audit utilities’
financial information, requires utilities to submit regular plans to address the impact of climate change on their infrastructure,
and initiates a proceeding for divestiture subject to constitutional protections due process and just compensation should the
large electric utilities fail to meet to be determined standards. The bill, as amended, passed the Maine Legislature in April 2022
and became law.
Late Payment Charge Order
Due to the COVID-19 pandemic, the State of New York previously issued an executive order on March 20, 2020 which,
among other items, resulted in the suspension of recovery of unbilled fees, including late payment fees and other fees associated
with customer non-payment including, but not limited to, connection fees and reconnection fees. On June 17, 2022, the NYPSC
issued an order authorizing NYSEG and RG&E to establish a surcharge to recover unbilled fees for Rate Year One and a
surcharge/surcredit for Rate Years Two and Three, subject to the offsetting cost reductions resulting from the COVID-19
pandemic, starting on July 1, 2022.
Customer Arrearages Reduction Order
On June 16, 2022, the NYPSC issued an order authorizing an arrears reduction program targeting low-income customers
to provide COVID-19-related relief through a one-time bill credit to eliminate accrued arrears through May 1, 2022. A portion
of the targeted arrearages will be funded via direct contributions from the State of New York, and the remainder to be received
via a surcharge to all customers. The surcharge recovery is over five years for RG&E and three years for NYSEG, which begins
on August 1, 2022.
60
Results of Operations
The following tables set forth financial information by segment for each of the periods indicated:
Three Months Ended Three Months Ended
June 30, 2022 June 30, 2021
Total Networks Renewables Other(1) Total Networks Renewables Other(1)
(in millions)
Operating Revenues $ 1,794 $ 1,464 $ 330 $ — $ 1,477 $ 1,219 $ 258 $ —
Operating Expenses
Purchased power, natural gas and fuel
used 440 384 56 — 265 236 29 —
Operations and maintenance 693 568 120 5 676 544 128 4
Depreciation and amortization 271 164 106 1 250 149 100 1
Taxes other than income taxes 169 148 20 1 155 143 17 (5)
Total Operating Expenses 1,573 1,264 302 7 1,346 1,072 274 —
Operating Income 221 200 28 (7) 131 147 (16) —
Other Income (Expense)
Other income (expense) 9 9 1 (1) 34 26 7 1
Earnings (losses) from equity method
investments 6 2 4 — 4 5 (1) —
Interest expense, net of capitalization (79) (61) (3) (15) (75) (53) — (22)
Income (Loss) Before Income Tax 157 150 30 (23) 94 125 (10) (21)
Income tax expense (benefit) (4) 21 (20) (5) 10 24 (21) 7
Net Income (Loss) 161 129 50 (18) 84 101 11 (28)
Net loss attributable to noncontrolling
interests 23 — 23 — 14 — 14 —
Net Income (Loss) Attributable to
Avangrid, Inc. $ 184 $ 129 $ 73 $ (18) $ 98 $ 101 $ 25 $ (28)
Six Months Ended Six Months Ended
June 30, 2022 June 30, 2021
Total Networks Renewables Other(1) Total Networks Renewables Other(1)
(in millions)
Operating Revenues $ 3,927 $ 3,399 $ 528 $ — $ 3,443 $ 2,792 $ 651 $ —
Operating Expenses
Purchased power, natural gas and fuel
used 1,181 1,140 41 — 766 685 81 —
Operations and maintenance 1,344 1,107 233 4 1,318 1,050 267 1
Depreciation and amortization 532 325 206 1 497 305 191 1
Taxes other than income taxes 347 308 38 1 325 292 36 (3)
Total Operating Expenses 3,404 2,880 518 6 2,906 2,332 575 (1)
Operating Income 523 519 10 (6) 537 460 76 1
Other Income (Expense)
Other income (expense) 20 21 2 (3) 35 32 1 2
Earnings (losses) from equity method
investments 259 5 254 — 5 7 (2) —
Interest expense, net of capitalization (150) (111) (6) (33) (148) (106) — (42)
Income (Loss) Before Income Tax 652 434 260 (42) 429 393 75 (39)
Income tax expense (benefit) 64 52 21 (9) 24 66 (30) (12)
Net Income (Loss) 588 382 239 (33) 405 327 105 (27)
Net loss (income) attributable to
noncontrolling interests 41 (1) 42 — 27 (1) 28 —
Net Income (Loss) Attributable to
Avangrid, Inc. $ 629 $ 381 $ 281 $ (33) $ 432 $ 326 $ 133 $ (27)
(1) "Other" represents Corporate and intersegment eliminations.
61

Comparison of Period to Period Results of Operations
Three Months Ended June 30, 2022 Compared to Three Months Ended June 30, 2021
Operating Revenues
Our operating revenues increased by $317 million, or 21%, from $1,477 million for the three months ended June 30,
2021 to $1,794 million for the three months ended June 30, 2022, as detailed by segment below:
Networks
Operating revenues increased by $245 million, or 20%, from $1,219 million for the three months ended June 30, 2021 to
$1,464 million for the three months ended June 30, 2022. Electricity and gas revenues increased by $37 million, primarily due
to rate increases in New York effective December 1, 2020, $17 million increase in late payment fees and $2 million of other.
Electricity and gas revenues changed due to the following items that have offsets within the income statement: an increase of
$148 million in purchased power and purchased gas (offset in purchased power) driven by higher average pricing in
commodities in the period and an increase of $41 million in flow through amortizations (offset in operating expenses).
Renewables
Operating revenues increased by $72 million, or 28%, from $258 million for the three months ended June 30, 2021 to
$330 million for the three months ended June 30, 2022. The increase in operating revenue is primarily driven by favorable MtM
changes of $83 million on energy derivative transactions entered into for economic hedging purposes and $8 million from
production, including new assets in service and curtailment payments in the current period, offset by a decrease of $15 million
in power trading driven by lower average prices in the second quarter of 2022 compared to the same period of 2021 and $4
million from the sale of assets in the second quarter of 2021.
Purchased Power, Natural Gas and Fuel Used
Our purchased power, natural gas and fuel used increased by $175 million, or 66%, from $265 million for the three
months ended June 30, 2021 to $440 million for the three months ended June 30, 2022, as detailed by segment below:
Networks
Purchased power, natural gas and fuel used increased by $148 million, or 63%, from $236 million for the three months
ended June 30, 2021 to $384 million for the three months ended June 30, 2022. The increase is primarily driven by a $148
million increase in average commodity prices and an overall increase in electricity and gas units procured due to higher degree
days in the period.
Renewables
Purchased power, natural gas and fuel used increased by $27 million, or 93%, from $29 million for the three months
ended June 30, 2021 to $56 million for the three months ended June 30, 2022. The increase is primarily due to unfavorable
MtM changes on derivatives of $54 million due to market price changes in the period, offset by a decrease of $27 in power and
gas purchases due to lower average prices in the current period.
Operations and Maintenance
Operations and maintenance expenses increased by $17 million, or 3%, from $676 million for the three months ended
June 30, 2021 to $693 million for the three months ended June 30, 2022, as detailed by segment below:
Networks
Operations and maintenance expenses increased by $24 million, or 4%, from $544 million for the three months ended
June 30, 2021 to $568 million for the three months ended June 30, 2022. The increase is driven by $7 million of increased
personnel expenses primarily driven by an increase in headcount, offset by a $24 million decrease in uncollectible expenses
driven primarily by the arrearages order in New York. In addition, there were increases of $41 million in flow-through
amortizations (which is offset in revenue).
Renewables
Operations and maintenance expenses decreased by $8 million, or 6%, from $128 million for the three months ended
June 30, 2021 to $120 million for the three months ended June 30, 2022. The decrease is primarily due to a decrease of $14
million driven by the write-off of certain development projects in the same period of 2021, $6 million of reclassifications (offset
in other income) recorded in 2021, offset by a $9 million increase in personnel costs driven primarily by increase in headcount
in the period and $3 million of other increases.
62

Depreciation and Amortization
Depreciation and amortization for the three months ended June 30, 2022 was $271 million compared to $250 million for
the three months ended June 30, 2021, representing an increase of $21 million. The increase is driven by $21 million from plant
additions in Networks and Renewables in the current period.
Other Income (Expense) and Earnings (Losses) from Equity Method Investments
Other income (expense) and equity earnings (losses) decreased by $23 million from $38 million for the three months
ended June 30, 2021 to $15 million for the three months ended June 30, 2022. The change is primarily due to a $5 million
unfavorable change in the non-service component of pension expense driven by the revised actuarial studies in Networks
(which is partially offset in revenue), decrease of $15 million from the carrying costs on regulatory deferrals primarily driven
by the rate case requirements in New York and $3 million other decreases in the period.
Interest Expense, Net of Capitalization
Interest expense for the three months ended June 30, 2022 and 2021 was $79 million and $75 million, respectively. The
change is primarily due to an increase of $4 million of interest expense at Networks from increased debt in the current period.
Income Tax Expense
The effective tax rates, inclusive of federal and state income tax, for the three months ended June 30, 2022 and 2021,
were (2.5)% and 10.6%, respectively, which are lower than the federal statutory tax rate of 21%, primarily due to the
recognition of production tax credits associated with wind production and the effect of the excess deferred tax amortization
resulting from the Tax Act.
Six Months Ended June 30, 2022 Compared to Six Months Ended June 30, 2021
Operating Revenues
Our operating revenues increased by $484 million, or 14%, from $3,443 million for the six months ended June 30, 2021
to $3,927 million for the six months ended June 30, 2022, as detailed by segment below:
Networks
Operating revenues increased by $607 million, or 22%, from $2,792 million for the six months ended June 30, 2021 to
$3,399 million for the six months ended June 30, 2022. Electricity and gas revenues increased by $63 million, primarily due to
rate increases in New York effective December 1, 2020, $10 million favorable impact from increased deferrals, $23 million
increase in late payment fees. Electricity and gas revenues changed due to the following items that have offsets within the
income statement: an increase of $455 million in purchased power and purchased gas (offset in purchased power) driven by
higher average pricing in commodities in the period and an increase of $56 million in flow through amortizations (offset in
operating expenses).
Renewables
Operating revenues decreased by $123 million, or 19%, from $651 million for the six months ended June 30, 2021, to
$528 million for the six months ended June 30, 2022. The decrease in operating revenues was primarily due to a $139 million
decrease in merchant prices driven mainly by lower demand as compared to the same period of 2021 when demand was higher
during the Texas storm, $34 million in power trading driven by lower average prices in the first half of 2022 compared to the
same period of 2021, $4 million from the sale of assets in the second quarter of 2021, offset by favorable MtM changes of $40
million on energy derivative transactions entered for economic hedging purposes, $14 million from production, including new
assets in service and curtailment payments in the current period.
Purchased Power, Natural Gas and Fuel Used
Purchased power, natural gas and fuel used increased by $415 million, or 54%, from $766 million for the six months
ended June 30, 2021 to $1,181 million for the six months ended June 30, 2022, as detailed by segment below:
Networks
Purchased power, natural gas and fuel used increased by $455 million, or 66%, from $685 million for the six months
ended June 30, 2021 to $1,140 million for the six months ended June 30, 2022. The increase is primarily driven by a $455
million increase in average commodity prices and an overall increase in electricity and gas units procured due to higher degree
days in the period.
Renewables
63

Purchased power, natural gas and fuel used decreased by $40 million, or 49%, from $81 million for the six months ended
June 30, 2021 to $41 million for the six months ended June 30, 2022. The decrease is primarily due to favorable MtM changes
on derivatives of $6 million driven by market price changes in the period and a decrease of $34 million in power and gas
purchases due to lower average prices in the current period.
Operations and Maintenance
Operations and maintenance expenses increased by $26 million, or 2%, from $1,318 million for the six months ended
June 30, 2021 to $1,344 million for the six months ended June 30, 2022, as detailed by segment below:
Networks
Operations and maintenance expenses increased by $57 million, or 5%, from $1,050 million for the six months ended
June 30, 2021 to $1,107 million for the six months ended June 30, 2022. The increase is driven by $8 million of increased
personnel expenses primarily driven by an increase in headcount, increased business costs of $25 million, offset by a $32
million decrease in uncollectible expenses driven primarily by the arrearages order in New York. In addition, there were
increases of $56 million in flow-through amortizations (which is offset in revenue).
Renewables
Operations and maintenance expenses decreased by $34 million, or 13%, from $267 million for the six months ended
June 30, 2021 to $233 million for the six months ended June 30, 2022. The decrease is primarily due to a $16 million bad debt
provision recorded in the first half of 2021 driven by an increase in uncollectibles billed during the Texas storm, decrease of
$20 million primarily driven by the write-off of certain development projects in the same period of 2021, $9 million in land
rents and maintenance costs driven by a lower number of new sites in 2022 compared to the same period of 2021 and $2 million
of other decreases, offset by a $13 million increase in personnel costs driven primarily by increase in headcount in the period.
Depreciation and Amortization
Depreciation and amortization for the six months ended June 30, 2022 was $532 million compared to $497 million for
the six months ended June 30, 2021, an increase of $35 million. The increase is driven by $29 million from plant additions in
Networks and Renewables in the period and $6 million increase driven by amortization of a deferred gain recorded in the first
half of 2021.
Other Income (Expense) and Earnings (Losses) from Equity Method Investments
Other income (expense) and equity earnings (losses) increased by $239 million from $40 million for the six months
ended June 30, 2021 to $279 million for the six months ended June 30, 2022. The increase is primarily due to a $246 million
gain recognized in the current period from the offshore joint venture restructuring transaction in Renewables, offset by $7
million unfavorable change in the non-service component of pension expense driven by the revised actuarial studies in
Networks (which is partially offset in revenue).
Interest Expense, Net of Capitalization
Interest expense for the six months ended June 30, 2022 and 2021 was $150 million and $148 million, respectively. The
change is primarily due to an increase of $4 million of interest expense at Networks from increased debt in the current period,
offset by a $2 million decrease driven by a favorable impact from the fair value hedge of the debt in Other.
Income Tax
The effective tax rates, inclusive of federal and state income tax, for the six months ended June 30, 2022 was 9.8%,
which is below the federal statutory tax rate of 21%, primarily due to the recognition of production tax credits associated with
wind production, the effect of the excess deferred tax amortization resulting from the Tax Act and the equity component of
allowance for funds used during construction, partially offset by the tax on gain from the offshore joint venture restructuring
transaction, which is reflected in total in the first half of 2022 as a discrete adjustment. The effective tax rates, inclusive of
federal and state income tax, for the six months ended June 30, 2021 was 5.6%, which was below the federal statutory tax rate
of 21%, primarily due to the recognition of production tax credits associated with wind production and the effect of the excess
deferred tax amortization resulting from the Tax Act.
Non-GAAP Financial Measures
To supplement our consolidated financial statements presented in accordance with U.S. GAAP, we consider adjusted net
income and adjusted earnings per share, adjusted EBITDA and adjusted EBITDA with Tax Credits as financial measures that
are not prepared in accordance with U.S. GAAP. The non-GAAP financial measures we use are specific to AVANGRID and
the non-GAAP financial measures of other companies may not be calculated in the same manner. We use these non-GAAP
financial measures, in addition to U.S. GAAP measures, to establish operating budgets and operational goals to manage and
64
monitor our business, evaluate our operating and financial performance and to compare such performance to prior periods and
to the performance of our competitors. We believe that presenting such non-GAAP financial measures is useful because such
measures can be used to analyze and compare profitability between companies and industries by eliminating the impact of
certain non-cash charges. In addition, we present non-GAAP financial measures because we believe that they and other similar
measures are widely used by certain investors, securities analysts and other interested parties as supplemental measures of
performance.
We define adjusted net income as net income adjusted to exclude mark-to-market earnings from changes in the fair value
of derivative instruments used by AVANGRID to economically hedge market price fluctuations in related underlying physical
transactions for the purchase and sale of electricity, costs incurred in connection with the COVID-19 pandemic and costs
incurred related to the PNMR Merger. We believe adjusted net income is more useful in understanding and evaluating actual
and projected financial performance and contribution of AVANGRID core lines of business and to more fully compare and
explain our results. The most directly comparable U.S. GAAP measure to adjusted net income is net income. We also define
adjusted earnings per share, or adjusted EPS, as adjusted net income converted to an earnings per share amount.
We define adjusted EBITDA as adjusted net income adjusted to fully exclude the effects of net (loss) income attributable
to noncontrolling interests, income tax expense (benefit), depreciation and amortization, interest expense, net of capitalization,
other (income) expense and (earnings) losses from equity method investments. We further define adjusted EBITDA with tax
credits as adjusted EBITDA adding back the pre-tax effect of retained Production Tax Credits (PTCs) and Investment Tax
Credits (ITCs) and PTCs allocated to tax equity investors. The most directly comparable U.S. GAAP measure to adjusted
EBITDA and adjusted EBITDA with tax credits is net income.
The use of non-GAAP financial measures is not intended to be considered in isolation or as a substitute for, or superior
to, AVANGRID’s U.S. GAAP financial information, and investors are cautioned that the non-GAAP financial measures are
limited in their usefulness, may be unique to AVANGRID, and should be considered only as a supplement to AVANGRID’s
U.S. GAAP financial measures. The non-GAAP financial measures may not be comparable to other similarly titled measures of
other companies and have limitations as analytical tools.
Non-GAAP financial measures are not primary measurements of our performance under U.S. GAAP and should not be
considered as alternatives to operating income, net income or any other performance measures determined in accordance with
U.S. GAAP.
65
The following tables provide a reconciliation between Net Income attributable to AVANGRID and non-GAAP measures
Adjusted Net Income, Adjusted EBITDA and Adjusted EBITDA with Tax Credits by segment for the three and six months
ended June 30, 2022 and 2021, respectively:
Three Months Ended June 30, 2022 Six Months Ended June 30, 2022
Total Networks Renewables Corporate* Total Networks Renewables Corporate*
(in millions) (in millions)
Net Income Attributable to Avangrid, Inc. $ 184 $ 130 $ 73 $ (18) $ 629 $ 381 $ 281 $ (33)
Adjustments:
Mark-to-market earnings – Renewables (8) — (8) — (5) — (5) —
Impact of COVID-19 (1) (1) — — 1 1 — —
Merger costs 2 — — 2 2 — — 2
Income tax impact of adjustments (1) 2 — 2 — 1 — 1 (1)
Adjusted Net Income (2) $ 178 $ 129 $ 66 $ (17) $ 628 $ 382 $ 277 $ (32)
Net (loss) income attributable to
noncontrolling interests (23) — (23) — (41) 1 (42) —
Income tax expense (benefit) (6) 21 (22) (5) 63 52 20 (8)
Depreciation and amortization 271 164 106 1 532 325 206 1
Interest expense, net of capitalization 79 61 3 15 150 111 6 33
Other (income) expense (9) (9) (1) 1 (20) (21) (2) 3
(Earnings) losses from equity method
investments (6) (2) (4) — (259) (5) (254) —
Adjusted EBITDA (3) $ 484 $ 363 $ 125 $ (5) $ 1,053 $ 846 $ 210 $ (3)
Retained PTCs and ITCs 48 — 48 — 91 — 91 —
PTCs allocated to tax equity investors 35 — 35 — 64 — 64 —
Adjusted EBITDA with Tax Credits (3) $ 567 $ 363 $ 208 $ (5) $ 1,208 $ 846 $ 366 $ (3)
66
Three Months Ended June 30, 2021 Six Months Ended June 30, 2021
Total Networks Renewables Corporate* Total Networks Renewables Corporate*
(in millions) (in millions)
Net Income Attributable to Avangrid, Inc. $ 98 $ 101 $ 25 $ (29) $ 432 $ 326 $ 133 $ (28)
Adjustments:
Mark-to-market earnings – Renewables 21 — 21 — 41 — 41 —
Impact of COVID-19 9 9 — — 15 15 — —
Merger costs 3 — — 3 4 — — 4
Income tax impact of adjustments (1) (9) (2) (6) (1) (16) (4) (11) (1)
Adjusted Net Income (2) $ 122 $ 108 $ 41 $ (26) $ 476 $ 337 $ 164 $ (25)
Net (loss) income attributable to
noncontrolling interests (14) — (14) — (27) 1 (28) —
Income tax expense (benefit) 19 26 (14) 7 40 70 (18) (12)
Depreciation and amortization 250 149 100 1 497 305 191 1
Interest expense, net of capitalization 75 53 (1) 23 148 106 (1) 43
Other (income) expense (34) (26) (7) (1) (35) (32) (1) (2)
(Earnings) losses from equity method
investments (4) (5) 1 — (5) (7) 2 —
Adjusted EBITDA (3) $ 414 $ 305 $ 105 $ 4 $ 1,094 $ 780 $ 309 $ 5
Retained PTCs and ITCs 48 — 48 — 93 — 93 —
PTCs allocated to tax equity investors 19 — 19 — 41 — 41 —
Adjusted EBITDA with Tax Credits (3) $ 481 $ 305 $ 172 $ 4 $ 1,228 $ 780 $ 443 $ 5
(1) Income tax impact of adjustments: 2022 - $2 million and $2 million from MtM earnings and $1 million and $0 from impact of COVID-19 and $(1)
million and $(1) million from merger costs for the three and six months ended June 30, 2022, respectively; 2021 - $(6) million and $(11) million from
MtM earnings, $(2) million and $(4) million from impact of COVID-19 and $(1) million and $(1) million from merger costs for the three and six months
ended June 30, 2021, respectively.
(2) Adjusted Net Income is a non-GAAP financial measure and is presented after excluding costs incurred in connection with the COVID-19 pandemic, the
impact from mark-to-market activities in Renewables and costs incurred related to the PNMR Merger.
(3) Adjusted EBITDA is a non-GAAP financial measure defined as adjusted net income adjusted to fully exclude the effects of net (loss) income attributable
to noncontrolling interests, income tax expense (benefit), depreciation and amortization, interest expense, net of capitalization, other (income) expense
and (earnings) losses from equity method investments. We further define adjusted EBITDA with tax credits as adjusted EBITDA adding back the pre-tax
effect of retained PTCs and ITCs and PTCs allocated to tax equity investors.
* Includes corporate and other non-regulated entities as well as intersegment eliminations.
Three Months Ended June 30, 2022 Compared to Three Months Ended June 30, 2021
Adjusted net income
Our adjusted net income increased by $56 million, or 46%, from $122 million for the three months ended June 30, 2021
to $178 million for the three months ended June 30, 2022. The increase is primarily due to a $26 million increase in
Renewables driven primarily by favorable pricing, production, including new assets in service and curtailment payments, and
favorable impacts from our tax equity partnerships in the current period, a $21 million increase in Networks driven primarily by
new rate case activity in New York which was approved November 19, 2020, an $11 million impact from the arrearages order
in New York, and $9 million decrease in Corporate mainly driven by favorable tax expense in the period.
Six Months Ended June 30, 2022 Compared to Six Months Ended June 30, 2021
Adjusted net income
Our adjusted net income increased by $152 million, or 32%, from $476 million for the six months ended June 30, 2021
to $628 million for the six months ended June 30, 2022. The increase is primarily due to a $113 million increase in Renewables
driven by a gain recognized in the current period from the offshore joint venture restructuring transaction, a $45 million
increase in Networks driven primarily by rate increases in New York effective December 1, 2020 and an $11 million impact
from the arrearages order in New York, offset by $7 million decrease in Corporate mainly driven by unfavorable tax expense in
the period.
67
The following tables reconcile Net Income attributable to AVANGRID to Adjusted Net Income (non-GAAP), and EPS
attributable to AVANGRID to adjusted EPS (non-GAAP) for the three and six months ended June 30, 2022 and 2021,
respectively:
Three Months Ended Six Months Ended
June 30, June 30,
(Millions)
2022 2021 2022 2021
Networks $ 130 $ 101 $ 381 $ 326
Renewables 73 25 281 133
Corporate (1) (18) (29) (33) (28)
Net Income $ 184 $ 98 $ 629 $ 432
Adjustments:
Mark-to-market earnings - Renewables (2) (8) 21 (5) 41
Impact of COVID-19 (3) (1) 9 1 15
Merger costs (4) 2 3 2 4
Income tax impact of adjustments 2 (9) 1 (16)
Adjusted Net Income (5) $ 178 $ 122 $ 628 $ 476
Three Months Ended Six Months Ended
June 30, June 30,
2022 2021 2022 2021
Networks $ 0.34 $ 0.29 $ 0.99 $ 0.99
Renewables 0.19 0.07 0.73 0.41
Corporate (1) (0.05) (0.08) (0.09) (0.08)
Net Income $ 0.48 $ 0.28 $ 1.63 $ 1.31
Adjustments:
Mark-to-market earnings - Renewables (2) (0.02) 0.06 (0.01) 0.13
Impact of COVID-19 (3) — 0.03 — 0.05
Merger costs (4) — 0.01 0.01 0.01
Income tax impact of adjustments 0.01 (0.03) — (0.05)
Adjusted Earnings Per Share (5) $ 0.46 $ 0.35 $ 1.62 $ 1.45
(1) Includes corporate and other non-regulated entities as well as intersegment eliminations.
(2) Mark-to-market earnings relates to earnings impacts from changes in the fair value of Renewables' derivative instruments associated with electricity and
natural gas.
(3) Represents costs incurred in connection with the COVID-19 pandemic, mainly related to bad debt provisions.
(4) Pre-merger costs incurred.
(5) Adjusted net income and adjusted earnings per share are non-GAAP financial measures and are presented after excluding costs incurred in connection
with the COVID-19 pandemic, the impact from mark-to-market activities in Renewables and costs incurred related to the PNMR Merger.
Liquidity and Capital Resources
Our operations, capital investment and business development require significant short-term liquidity and long-term
capital resources. Historically, we have used cash from operations and borrowings under our credit facilities and commercial
paper program as our primary sources of liquidity. Our long-term capital requirements have been met primarily through
retention of earnings, equity issuances and borrowings in the investment grade debt capital markets. Continued access to these
sources of liquidity and capital are critical to us. Risks may increase due to circumstances beyond our control, such as a general
disruption of the financial markets and adverse economic conditions.
We and our subsidiaries are required to comply with certain covenants in connection with our respective loan
agreements. The covenants are standard and customary in financing agreements, and we and our subsidiaries were in
compliance with such covenants as of and throughout the June 30, 2022.
Liquidity Position
We optimize our liquidity within the United States through a series of arms-length intercompany lending arrangements
with our subsidiaries and among our regulated utilities to provide for lending of surplus cash to subsidiaries with liquidity
68

needs, subject to the limitation that the regulated utilities may not lend to unregulated affiliates. These arrangements minimize
overall short-term funding costs and maximize returns on the temporary cash investments of the subsidiaries. We have the
capacity to borrow up to $3,575 million from the lenders committed to the AVANGRID Credit Facility and $500 million from
an Iberdrola Group Credit Facility, each of which are described below.
The following table provides the components of our liquidity position as of June 30, 2022 and December 31, 2021,
respectively:
As of June 30,
As of
December 31,
2022 2021
(in millions)
Cash and cash equivalents
$ 411 $ 1,474
AVANGRID Credit Facility
3,575 3,575
Iberdrola Group Credit Facility
500 500
Less: borrowings
— —
Total
$ 4,486 $ 5,549
AVANGRID Commercial Paper Program
AVANGRID has a commercial paper program with a limit of $2 billion that is backstopped by the AVANGRID Credit
Facility (described below). As of both June 30, 2022 and July 26, 2022, there was $0 of commercial paper outstanding.
AVANGRID Credit Facility
AVANGRID and its subsidiaries, NYSEG, RG&E, CMP, UI, CNG, SCG and BGC, each of which are joint borrowers,
have a revolving credit facility with a syndicate of banks, or the AVANGRID Credit Facility, that provides for maximum
borrowings of up to $3,575 million in the aggregate, which was executed on November 23, 2021. The agreement contained a
commitment from lenders, which expired on April 20, 2022 to increase maximum borrowings to $4,000 million upon the
joinder of PNM and TNMP as borrowers under the AVANGRID Credit Facility.
Under the terms of the AVANGRID Credit Facility, each joint borrower has a maximum borrowing entitlement, or
sublimit, which can be periodically adjusted to address specific short-term capital funding needs, subject to the maximum limit
contained in the agreement. On November 23, 2021, the executed AVANGRID Credit Facility increased AVANGRID's
maximum sublimit from $1,500 million to $2,500 million. The AVANGRID Credit Facility contains pricing that is sensitive to
AVANGRID’s consolidated greenhouse gas emissions intensity. The Credit Facility also contains negative covenants,
including one that sets the ratio of maximum allowed consolidated debt to consolidated total capitalization at 0.65 to 1.00, for
each borrower. Under the AVANGRID Credit Facility, each of the borrowers will pay an annual facility fee that is dependent
on their credit rating. The initial facility fees will range from 10 to 22.5 basis points. The maturity date for the AVANGRID
Credit Facility is November 22, 2026. As of both June 30, 2022 and July 26, 2022, we had no borrowings outstanding under
this credit facility.
Since the AVANGRID credit facility is also a backstop to the AVANGRID commercial paper program, the total amount
available under the facility as of both June 30, 2022 and July 26, 2022, was $3,575 million.
Iberdrola Group Credit Facility
AVANGRID has a credit facility with Iberdrola Financiacion, S.A.U., a company of the Iberdrola Group. The facility
has a limit of $500 million and matures on June 18, 2023. AVANGRID pays a facility fee of 10.5 basis points annually. As of
both June 30, 2022 and July 26, 2022, we had no borrowings outstanding under this credit facility.
Capital Resources
On January 31, 2022, UI issued $150 million aggregate principal amount of unsecured notes maturing in 2032 at a fixed
interest rate of 2.25%.
On April 6, 2022, NYSEG issued $67 million aggregate principal amount of Pollution Control Bonds maturing in 2028.
The bonds bear a 4.00% fixed coupon and were priced at 104.15% to yield 3.3%.
Capital Requirements
We expect to fund our capital requirements, including, without limitation, any quarterly shareholder dividends and
capital investments primarily from the cash provided by operations of our businesses and through the access to the capital
markets in the future. We have revolving credit facilities, as described above, to fund short-term liquidity needs and we believe
69

that we will continue to have access to the capital markets as long-term growth capital is needed. To date, the Company has not
experienced limitations in our ability to access these sources of liquidity in connection with the COVID-19 pandemic. While
taking into consideration the current economic environment, management expects that we will continue to have sufficient
liquidity and financial flexibility to meet our business requirements.
We expect to incur approximately $1.2 billion in capital expenditures through the remainder of 2022. This estimate is
subject to continuing review and actual capital expenditures may vary significantly. For example, the U.S. Department of
Commerce's anti-circumvention petition alleging that solar panels and cells shipped from Vietnam, Thailand, Malaysia and
Cambodia could result in higher than expected costs for projects beyond 2022. As a result, the timing and ultimate cost
associated with solar panels and cells and related project capital expenditures may vary from our current expectations.
Cash Flows
Our cash flows depend on many factors, including general economic conditions, regulatory decisions, weather,
commodity price movements and operating expense and capital spending control.
The following is a summary of the cash flows by activity for the six months ended June 30, 2022 and 2021, respectively:
Six Months Ended
June 30,
2022 2021
(in millions)
Net cash provided by operating activities
$ 805 $ 851
Net cash used in investing activities
(1,492) (1,001)
Net cash (used in) provided by financing activities
(376) 416
Net (decrease) increase in cash, cash equivalents and restricted cash
$ (1,063) $ 266
Operating Activities
The cash from operating activities for the six months ended June 30, 2022 compared to the six months ended June 30,
2021 decreased by $46 million, primarily attributable to a net decrease in current assets and liabilities driven by timing of cash
collections and cash disbursements during the period.
Investing Activities
For the six months ended June 30, 2022, net cash used in investing activities was $1,492 million, which was comprised
of $1,403 million of capital expenditures and $168 million of payment for the offshore joint venture restructuring transaction,
partially offset by $80 million of contributions in aid of construction.
For the six months ended June 30, 2021, net cash used in investing activities was $1,001 million, which was comprised
of $1,264 million of capital expenditures partially offset by $231 million of other investments and equity method investments,
$21 million of contributions in aid of construction, $5 million of proceeds from the sale of assets and $4 million of distributions
received from equity method investments.
Financing Activities
For the six months ended June 30, 2022, financing activities used $376 million in cash reflecting primarily a net decrease
in non-current debt and current notes payable of $160 million, distributions to non-controlling interests of $6 million and
dividends of $340 million, offset by contribution from non-controlling interests of $138 million in the period.
For the six months ended June 30, 2021, financing activities provided $416 million in cash reflecting primarily proceeds
from private placements of $4 billion in connection with share issuance and contribution from non-controlling interests of $10
million in the period, offset by a net decrease in non-current debt with affiliate and current notes payable of $3.3 billion,
dividends of $272 million and distributions to non-controlling interests of $5 million.
Off-Balance Sheet Arrangements
There have been no material changes in our off-balance sheet arrangements during the six months ended June 30, 2022
as compared to those reported for the fiscal year ended December 31, 2021 in our Form 10-K.
Contractual Obligations
There have been no material changes in contractual and contingent obligations during the six months ended June 30,
2022 as compared to those reported for the fiscal year ended December 31, 2021 in our Form 10-K.
70
Critical Accounting Policies and Estimates
We have prepared the accompanying condensed consolidated financial statements provided herein in accordance with
U.S. GAAP. In preparing the accompanying condensed consolidated financial statements, our management has made certain
estimates and assumptions that affect the reported amounts of assets, liabilities, stockholders’ equity, revenues and expenses
and the disclosures thereof. While we believe that these policies and estimates used are appropriate, actual future events can and
often do result in outcomes that can be materially different from these estimates. As of June 30, 2022, the only notable changes
to the significant accounting policies described in our Form 10-K for the fiscal year ending December 31, 2021, are with respect
to our adoption of the new accounting pronouncements described in the Note 3 of our condensed consolidated financial
statements for the six months ended June 30, 2022.
New Accounting Standards
We review new accounting standards to determine the expected financial effect, if any, that the adoption of each such
standard will have. The new accounting pronouncements we have adopted as of January 1, 2022, and reflected in our condensed
consolidated financial statements are described in Note 3 of our condensed consolidated financial statements for the six months
ended June 30, 2022.
71
CAUTIONARY STATEMENT REGARDING FORWARD-LOOKING STATEMENTS
This Quarterly Report on Form 10-Q contains a number of forward-looking statements. Forward-looking statements may
be identified by the use of forward-looking terms such as “may,” “will,” “should,” “would,” “could,” “can,” “expect(s),”
“believe(s),” “anticipate(s),” “intend(s),” “plan(s),” “estimate(s),” “project(s),” “assume(s),” “guide(s),” “target(s),”
“forecast(s),” “are (is) confident that” and “seek(s)” or the negative of such terms or other variations on such terms or
comparable terminology. Such forward-looking statements include, but are not limited to, statements about our plans,
objectives and intentions, outlooks or expectations for earnings, revenues, expenses or other future financial or business
performance, strategies or expectations, or the impact of legal or regulatory matters on business, results of operations or
financial condition of the business and other statements that are not historical facts. Such statements are based upon the current
reasonable beliefs, expectations, and assumptions of our management and are subject to significant risks and uncertainties that
could cause actual outcomes and results to differ materially. Important factors are discussed and should be reviewed in our
Form 10-K and other subsequent filings with the SEC. Specifically, forward-looking statements include, without limitation:
• the future financial performance, anticipated liquidity and capital expenditures;
• actions or inactions of local, state or federal regulatory agencies;
• the ability to recruit and retain a highly qualified and diverse workforce in the competitive labor market;
• changes in amount, timing or ability to complete capital projects;
• adverse developments in general market, business, economic, labor, regulatory and political conditions including,
without limitation, the impacts of inflation, deflation, supply-chain interruptions and changing prices and labor
costs, including the Department of Commerce's anti-circumvention petition that could adversely impact renewable
solar energy projects;
• the impacts of climate change, fluctuations in weather patterns and extreme weather events;
• technological developments;
• the impact of extraordinary external events, such as any cyber breaches or other incidents, grid disturbances, acts of
war or terrorism, civil or social unrest, natural disasters, pandemic health events or other similar occurrences,
including the ongoing geopolitical conflict with Russia and Ukraine;
• the impact of any change to applicable laws and regulations, including those subject to referendums and legal
challenges, affecting the ownership and operations of electric and gas utilities and renewable energy generation
facilities, respectively, including, without limitation, those relating to the environment and climate change, taxes,
price controls, regulatory approval and permitting;
• our ability to close the proposed Merger (as defined in "Note 1 - Background and Nature of Operations" to the
accompanying unaudited condensed consolidated financial statements under Part I, Item 1 of this report), the
anticipated timing and terms of the proposed Merger, our ability to realize the anticipated benefits of the proposed
Merger and our ability to manage the risks of the proposed Merger;
• the COVID-19 pandemic, its impact on business and economic conditions, including but not limited to impacts
from consumer payment behavior and supply chain delays, and the pace of recovery from the pandemic;
• the implementation of changes in accounting standards;
• adverse publicity or other reputational harm; and
• other presently unknown unforeseen factors.
Should one or more of these risks or uncertainties materialize, or should any of the underlying assumptions prove
incorrect, actual results may vary in material respects from those expressed or implied by these forward-looking statements.
You should not place undue reliance on these forward-looking statements. We do not undertake any obligation to update or
revise any forward-looking statements to reflect events or circumstances after the date of this report, whether as a result of new
information, future events or otherwise, except as may be required under applicable securities laws. Other risk factors are
detailed from time to time in our reports filed with the SEC, and we encourage you to consult such disclosures.
Item 3. Quantitative and Qualitative Disclosures about Market Risk
There have been no material changes in our market risk during the six months ended June 30, 2022, as compared to those
reported for the fiscal year ended December 31, 2021 in our Form 10-K.
Item 4. Controls and Procedures
Evaluation of Disclosure Controls and Procedures
Our management, with the participation of our Chief Executive Officer, or CEO, and our Chief Financial Officer, or
CFO, has evaluated the effectiveness of our disclosure controls and procedures (as defined in Rules 13a- 15(e) and 15d- 15(e)
under the Securities Exchange Act of 1934, as amended (Exchange Act)), as of the end of the period covered by this Quarterly
72
Report on Form 10-Q. Based on such evaluation, our CEO and CFO have concluded that as of such date, our disclosure
controls and procedures were effective.
Changes in Internal Control
There has been no change in our internal control over financial reporting identified in management’s evaluation pursuant
to Rules 13a-15(d) or 15d-15(d) of the Exchange Act during the period covered by this Quarterly Report on Form 10-Q that
materially affected, or are reasonably likely to materially affect, our internal control over financial reporting.
Limitations on Effectiveness of Controls and Procedures
In designing and evaluating the disclosure controls and procedures, management recognizes that any controls and
procedures, no matter how well designed and operated, can provide only reasonable assurance of achieving the desired control
objectives. In addition, the design of disclosure controls and procedures must reflect the fact that there are resource constraints
and that management is required to apply judgment in evaluating the benefits of possible controls and procedures relative to
their costs.
73
PART II. OTHER INFORMATION
Item 1. Legal Proceedings
Please read “Note 8—Contingencies” and “Note 9—Environmental Liabilities” to the accompanying unaudited
condensed consolidated financial statements under Part I, Item 1 of this report for a discussion of legal proceedings that we
believe could be material to us.
Item 1A. Risk Factors
Shareholders and prospective investors should carefully consider the risk factors disclosed in our Form 10-K for the
fiscal year ended December 31, 2021. The only significant changes to our risk factors relate to following items:
There is a risk new tariffs imposed on imported goods could result in, among other items, increases in capital
expenditures in projects, negative impacts of expected returns, impacts to the completion and delivery of projects,
abandonment of the development on projects, which could have a material effect on AVANGRID's business, financial
condition, and results of operations.
Changes in tariffs may affect the final cost of a significant portion of capital expenses in projects, with renewable
projects being more exposed. Tariffs have been imposed in the recent years to imports of solar panels, aluminum and steel,
among other goods or raw materials. Currently, the Department of Commerce, or DOC, is conducting an inquiry into an anti-
circumvention petition alleging that solar panels and cells shipped from Vietnam, Thailand, Malaysia and Cambodia have
circumvented tariffs imposed on Chinese solar panels and cells. The petition calls for anti-dumping and countervailing duties to
be applied to solar panels and cells and could be retroactive to the filing date. In June, 2022, the Administration put a 24-month
freeze on any potential tariff resulting from the anti-circumvention investigation. Despite the 24-month freeze, there is
uncertainty around the final resolution by the DOC and related long-term effects to the solar panel supply chain, meaning that
we currently cannot predict if there will be materially adverse impacts to our business, results of operations or financial
condition. If imposed, this tariff could affect, among other items, capital expenditures, expected returns on approved projects,
completion and delivery of projects, and abandonment of the development on projects and associated contracts, including
related costs.
AVANGRID is subject to substantial regulation by federal, state and local regulatory agencies and our business,
results of operations and prospects may be adversely affected by legislative or regulatory changes, as well as liability under,
or any future inability to comply with, existing or future regulations or requirements.
AVANGRID’s operations are subject to, and influenced by, complex and comprehensive federal, state and local
regulation and legislation. This is impactful for all areas of the business but particularly in the emerging development of
offshore and solar generation. In late March, the House passed the Coast Guard Authorization Act of 2022 and in mid-July the
House passed the National Defense Authorization Act. If enacted, the bills may only allow foreign vessels to operate on the
Outer Continental Shelf if they have (a) a U.S. crew or (b) the crew of the nation of which the vessel is from. If passed, this
legislation could affect expected timelines and returns on approved projects. Additionally, legislation seeking to block the
import of products made with forced labor in certain areas of China could prevent some suppliers from importing, among other
products, solar panels into the U.S. or cause significant delay in panel delivery. This legislation could have an impact on solar
project development, construction activities and project returns.
Russian forces launched an invasion of Ukraine on February 24, 2022. This action could exacerbate existing risk
factors highlighted in our Form 10-K for the fiscal year ended December 31, 2021.
The recent geopolitical developments may further intensify risk factors highlighted in our Form 10-K for the fiscal year
ended December 31, 2021 including, but not limited to, risks around inflation, supply chain delays and heightened
cybersecurity threats.
Item 2. Unregistered Sales of Equity Securities and Use of Proceeds
None.
Item 3. Defaults Upon Senior Securities
None.
Item 4. Mine Safety Disclosures
Not applicable.
Item 5. Other Information
None.
74

Item 6. Exhibits
The following documents are included as exhibits to this Form 10-Q:
Exhibit
Number Description
10.1 Employment Agreement, dated Jun 1, 2022, between Avangrid Management Company, LLC and Pedro
Azagra Blázquez.†
10.2 Employment Agreement, dated Jun 29, 2022, between Avangrid Management Company, LLC and Patricia
Cosgel.†
31.1 Chief Executive Officer Certification pursuant to Rule 13a-14(a) and 15d-14(a), as adopted pursuant to
Section 302 of the Sarbanes-Oxley Act of 2002.*
31.2 Chief Financial Officer Certification pursuant to Rule 13a-14(a) and 15d-14(a), as adopted pursuant to
Section 302 of the Sarbanes-Oxley Act of 2002.*
32 Certification pursuant to 18 United States Code Section 1350, as adopted pursuant to Section 906 of the
Sarbanes-Oxley Act of 2002.*
101.INS XBRL Instance Document.*
101.SCH XBRL Taxonomy Extension Schema Document.*
101.CAL XBRL Taxonomy Extension Calculation Linkbase Document.*
101.DEF XBRL Taxonomy Extension Definition Linkbase Document.*
101.LAB XBRL Taxonomy Extension Label Linkbase Document.*
101.PRE XBRL Taxonomy Extension Presentation Linkbase Document.*
*Filed herewith.
†Compensatory plan or agreement.
75

SIGNATURES
Pursuant to the requirements of the Securities Exchange Act of 1934, the registrant has duly caused this report to be signed on
its behalf by the undersigned thereunto duly authorized.
Avangrid, Inc.
Date: July 27, 2022 By:
/s/ Pedro Azagra Blázquez
Pedro Azagra Blázquez
Director and Chief Executive Officer
Date: July 27, 2022 By: /s/ Patricia S. Cosgel
Patricia S. Cosgel
Senior Vice President - Chief Financial Officer
76
